
Experienced vibration analysts or reliability leaders who have spent considerable time managing a vibration program can tell you just how important alarms can be. Those who embrace the concept of using alarms will find themselves catching defects more efficiently, saving valuable time, and enjoying their job. Those who neglect alarms will find themselves overworked and overwhelmed.
What is an alarm?
An alarm consists of predefined thresholds that warn us when vibration amplitudes or other parameters exceed acceptable limits. A good vibration program will have a group of alarms that are used to assist the analyst in determining which machines are okay. Furthermore, they can also tell us which machines may need some attention or even shut down!
Some vibration data collectors and software systems will allow the analyst to assign colors to each alarm stage. That said, the most basic way to put this would be “Green machines–good” and “Red machines–bad”. This may seem very straightforward for now, but it does get a bit more complex from here. Let’s cover a few things to watch out for when creating these alarm thresholds and establish some best practices for using alarms in your program.
Route-Based vs. Continuous Monitoring
The way alarms are applied and managed will vary significantly between route-based programs and continuous monitoring. After all, these two types of programs are drastically different in their entire process.
Route-Based Alarms:
Alarms in a route-based program are primarily put in place to draw the analyst’s attention to certain machines. Often, if alarms are set properly an analyst can assume that any machine that is not in alarm can be skipped over and considered good. By the same token, machines that are “in alarm” will need to be analyzed to determine the reason for the alarm.
Alarms in a route-based program are also extremely helpful when it comes to generating reports. Most vibration analysis software programs will contain some kind of site status report that depends on alarms to categorize machines. These alarm status reports are extremely handy for an analyst to deliver to his supervisors or planners who only want an overview of the condition of the plant’s rotating assets.
Continuous Monitoring Alarms:
Alarms may be the most advantageous when implemented into a continuous monitoring program. A good continuous monitoring program has the functionality to send notifications through email or SMS messages. This provides huge advantages for machine owners, analysts, reliability leaders and any other team members that are set up to receive such notifications.
In a continuous monitoring program, alarms can be set in place to alert an entire team the instant a machine or bearing goes into alarm. This immediate notification method can dramatically reduce unplanned downtime. We don’t need to wait three weeks for the analyst to run his route again and another two days for analysis and reporting to be completed.
Continuous monitoring systems also give us the ability to trigger alarms on multiple technologies simultaneously. For example, a machine that is being monitored with wireless vibration sensors can often provide alarms for vibration, temperature, rpm, and more. These alarms notifications occurring in certain combinations at one time can tell a very particular story.
The most successful vibration programs use a blend of route-based and continuous monitoring strategies, incorporating alarms into both.
What parameters can alarms be set on?
When people think of vibration alarms they typically think only of overall vibration amplitudes. While that parameter may be the most common alarm, there are a multitude of other useful values we can alarm from. Here are a few examples to consider:
- Velocity RMS- Overall
- Acceleration RMS- Overall
- Displacement Peak or Peak-to-Peak
- Peak Acceleration (Max Peak)
- Temperature
- Powerbands
- Crest Factor
- Kurtosis
- RPM
- Manual Entries (Current, Flow, Pressure, Load etc.)
- Envelope Values
As you can see, alarms can become extremely beneficial to a program. To go a step further, there are several alarm parameters that can be used in a continuous monitoring program to warn of issues with the monitoring devices themselves. Here are a few examples of those.
- Battery level
- Signal strength (Sensor to Receiver)
- Signal strength (Receiver to Outside World)
- Ambient Temperature
- Sensor Temperature
- Machine Temperature
- Receiver Online Status (Power Loss)
- Sensor Online Status
As technology continues to advance, the list of parameters that we can use for an alarm strategy will continue to grow.
Conclusion
Now that alarms have been defined, be sure to check out the second part of this series to learn practical tips on setting and maintaining alarms.
by Diana Pereda
Runout, in regard to industrial machinery, is most commonly defined as a deviation from a rotor’s true circular path or concentricity in a machine shaft or coupling. Visually, the shaft or coupling (or both) will typically “wobble” slightly throughout their rotation.
Runout typically causes a loading/unloading cycle that’s repeated during every rotation of the shaft. This type of scenario can cause many issues such as accelerated wear on bearings, seals, and couplings, as well as increased load on the motor, reducing its efficiency and shortening its life span. Here is a list of a few things to consider when measuring for runout.
- Use a traditional dial indicator or an electronic runout probe to obtain your readings. Make sure your indicator base (typically magnetic) is securely fixed to a fully stationary machine surface or similar to ensure there will be no movement in the base while taking your readings.
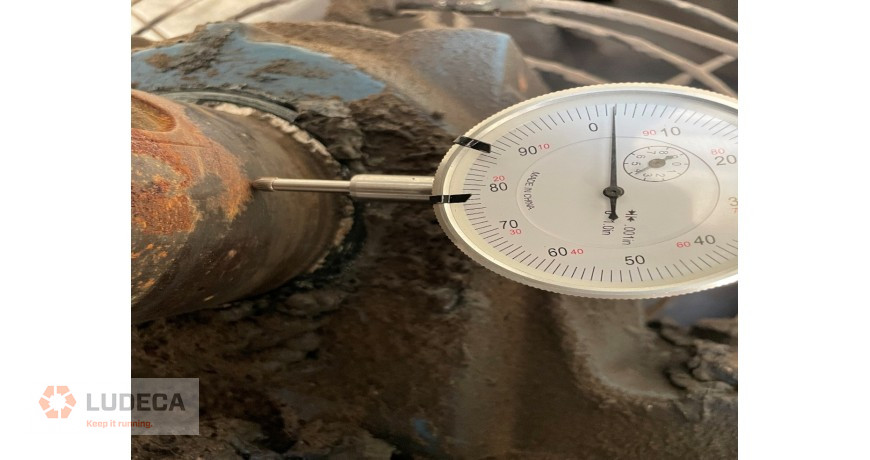
- Typically, you will start with an indicator mounted perpendicular to the shaft with the probe on the outside diameter or rim of the coupling hub, then rotate the shaft. This will tell you if there is runout in your equipment but will not identify whether the runout is in the coupling hub, the shaft, or both.
- Runout can occur from several causes. You could have a bent shaft. Your coupling hub bore could be off center. Your shaft could be undersized, or your coupling hub bore oversized, causing the coupling hub set screws to pull the coupling hub off center during installation. In some cases, your coupling hub bore could even be skewed, meaning the center of the bore on one side of the hub is in a different location than the center of the bore on the other side. To verify this, take axial readings. The probe should be on the coupling hub face, parallel to the shaft.
- How much runout is too much? Generally, we look to have runout of 0.002″ or less as an industry standard; however, this depends on several factors, including speed and drive type. Typically, runout of 0.005″ or more is considered excessive.
So, How Can We Catch Potential Runout Defects Before They Cause Major Issues?
- The answer is condition monitoring and quality vibration analysis. There are some scenarios where performing a runout check should be part of the routine for the task at hand. In particular, runout should be checked during pre-alignment procedures in both direct drive and belt-driven machinery. Many times, however, the issue occurs before we’ve had a reason to check the runout.
- Using Ludeca’ s lineup of Betavib vibration data collectors and analyzers will allow you to catch runout issues early. Runout will typically show up in the spectrum as a dominant 1× frequency and will likely have elevated 1× vibration in the axial direction as well. We can use phase analysis to further distinguish between runout, misalignment, and unbalance.
by Diana Pereda
Sometimes unbalance can be caused by a shaft key being too long. When a shaft assembly goes to the balance machine, the assembly is normally balanced with a half key installed. The coupling and key have been removed and a half key installed into the keyway on the shaft. The straight portion of the shaft keyway is filled with a piece of steel; however its height is ground down so that it closely matches the outer radius of the shaft. In other words, it doesn’t stick out!
Electrical tape is then wrapped around the half key and shaft so that the half key doesn’t come flying out during the balancing operation. After the rotating assembly has been successfully balanced to within tolerance, the rotating assembly is returned to the technician for final reassembly.
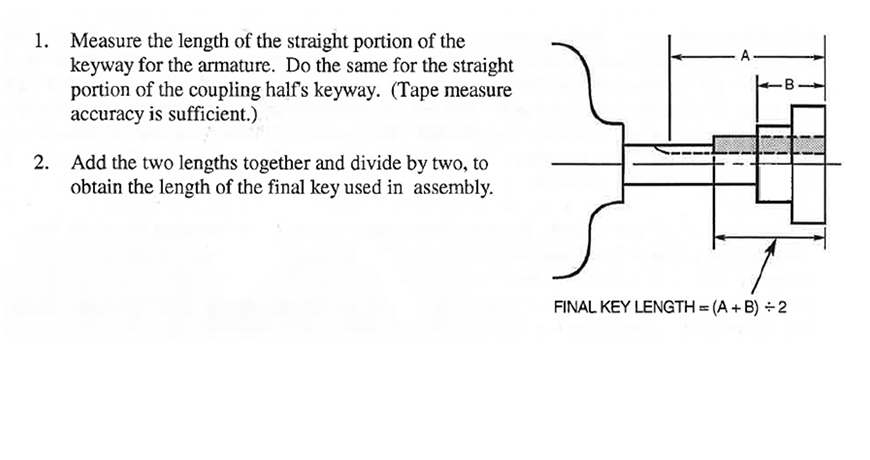
In the following example, let’s assume that the actual length of the keyway in the shaft is 8 inches long and 3/8″ deep. The length of the coupling hub keyway is 4 inches long and it is also 3/8″ deep. If the technician installed a key that measured 8″ long × ¾” × ¾” and then mounted the coupling onto the shaft it would result in an excessive key length sticking out past the back edge of the coupling hub. The extra 4 inches × 3/8″ high key stock sticking out behind the coupling could be enough mass to cause the imbalance to exceed ISO balance tolerances.
The following method should be used to calculate the proper key length:
Our advanced field balancers can help you identify, correct and avoid the unwanted consequences of equipment unbalance. For more information, visit our website.
What Causes Machinery Unbalance? Here are 10 Factors Preventing a Successful Balancing Job
by Ana Maria Delgado, CRL
Vibration data is, at its heart, complex. Analysts require many years of experience in both reviewing data and a high-level understanding of the machinery. The two skills are not typically closely aligned, one being a deep technical understanding of the physical and electrical characteristics of a machine in a given process, the other a more mathematical approach to data analysis.
Despite the differences in these aspects, there exists a community around the world of individuals who have grasped these skills and add real value to maintenance programs. This is not only because of a personal desire from these individuals to upskill but also the result of a multitude of tools and established training programs to help demystify the underlying data. With the introduction of wireless condition monitoring tools, a new generation of technicians, fitters, and electricians are being exposed to the world of predictive maintenance.

However, some of these systems can abstract away the underlying datasets to present a simplified overview of the machinery’s health. Some systems take it a step further and suggest the appropriate fixes. The ideal system allows for high-quality machine diagnosis completed by an expert in analysis with support from automated systems. Ensuring that a human remains in the loop will help a company maintain confidence in their established conditioning monitoring programs.
The balance between human expertise and technological advancement highlights the ongoing need for comprehensive training and continuous learning in the vibration analysis field. As predictive maintenance technologies evolve, so too must the skill set of those who use them. The future of maintenance programs relies, not only on developing more sophisticated tools but also on cultivating a workforce capable of leveraging these tools to their fullest potential, thus allowing individuals and teams to ensure true operational excellence.
Encouraging a culture of lifelong learning and curiosity is essential for ensuring that maintenance professionals can adapt to new technologies and methodologies. This approach not only enhances the effectiveness of maintenance strategies but also fosters innovation within the field, pushing the boundaries of what is possible in predictive maintenance and machinery diagnostics. High-quality diagnostics are essential to drive further efficiencies and reduce costly downtime. Therefore, it is in everyone’s interest to keep training, adopting new technologies, and sharing knowledge.
Thank you David Procter with Sensoteq for sharing this educational article with us!
Choosing The Right Machines for Wireless Vibration Sensor Placement
by Diana Pereda
When it comes to condition monitoring, wireless technology is becoming ubiquitous for sensing applications. But many analysts still have a tried and tested portable monitor in their arsenal, so this begs the question, why should wireless sensors be used, and is there still a place for the more traditional route-based option?
When to break free
Catching the issue
Probably the single biggest advantage to wireless technology is nothing to do with transmission technology at all, rather what it enables by constantly transmitting data. Traditional route-based systems would provide a measurement once per visit, sometimes every week, but more likely only twice a year. Whilst this provides some good analysis output and an opportunity to actual touch and look at the machine, it can miss faults that only happen periodically. Furthermore, there is not always a guarantee that the machine will be operating in normal condition.
Safety concerns
Accessing the key part of the machine can be a tricky task – but especially when safety guards and protections must be circumvented to permit this. All the better to have a pre-installed device take the reading and transmit it wirelessly – thus mitigating the risk of injury completely. Sensors can also be placed in locations that would otherwise be completely inaccessible otherwise.
Stick to tried and tested
Additional diagnosis
Despite the obvious benefits of wireless technology there are still times when breaking out the portable analyzer will yield better results. This is particularly true for dual-sensor phase-based measurements, such as identifying cocked bearing or oil whip on journal bearings, but these are both relatively uncommon conditions. Portable readers also have the capability to take long, high resolution measurements for very specific machine configurations and speeds.
Getting “eyes on”
Whilst wireless sensors can offer the ability to understand machine health remotely, from anywhere in the world, sometimes nothing can beat being physically present at the machine – this allows for a visual inspection. A sensor can tell you a lot about your machine, but it might not be able to tell you that some boxes have been sucked into a fan vent!
In conclusion, there is a place for both tools into today’s predictive maintenance strategies. Portable analyzers are great learning tools, and the workflow is still appropriate for some organizations. In contrast, remote wireless sensors provide a glimpse of your machine’s behavior multiple times a day, sometimes as fast as every minute. This will allow the analysts to see trends over days and months and act on emerging issues, rather than reacting after the fact. The capability gap between the two is closing.
Thank you Sensoteq for sharing this educational article with us!
by Diana Pereda
My thoughts on this subject had their genesis from instruction I was fortunate to receive years ago from two different individuals. One was teaching an advanced analysis class at the time, and he included orbits on roller bearing systems. His point was to try and understand the forces acting on the rotor more comprehensively.
Soon after attending that training, I had the opportunity to attend an advanced analysis class taught by Ralph Buscarello. Ralph was a master at making complicated things simple, and simple is where I dwell. Now, when I am using phase, I try to fit what I know about the physical and structural makeup of the machine into the “kiss” principle. Many times, it’s easiest to use phase and visualize the orbit indicated by the phase to help diagnose a problem. This works really well when it comes to unbalance and misalignment.
Following I’ll present a couple of simple examples. These work on a single bearing.
If we measure phase on a single bearing at the horizontal point and the vertical point, what should we expect the orbit of that shaft within the bearing to look like? On the bearing of a normal healthy rotor, the phase angle of the H relative to the V should be about 90 degrees. I say this because for a typical healthy rotor, having a good precise alignment, with clearances at all fits within proper tolerances, and having a residual unbalance condition below the level where the unbalance might in any way be life limiting, the unbalance should still easily be the dominant force affecting the orbit. This rotor would typically display a mostly circular orbit with a phase difference of about 90°, give or take a few degrees:
Orbit: 
If we have the defect of an unacceptably high unbalance, this rotor will intensify its propensity to follow this circular orbit, and the amplitudes will also become more comparable to one another at the H and V orientations as long as no resonance manifests itself.
On the other hand, if we get a zero or near zero-degree phase shift between the two points, the most common culprit will be misalignment. The first time I was confronted with such data, my initial reaction was, “how can the heavy spot be at the horizontal sensor and the vertical sensor simultaneously? To answer this question, the orbit visualization helps greatly. With the orbit shape below, one can see that the highest amplitude on both sensors will be reached virtually simultaneously.
Orbit:
Note: A 180° to near 180° phase difference indicates the same type of elliptical motion. Here the forces of misalignment are constraining the movement of the rotor to ‘jerk’ from one area of freedom to the other and restricting the rotor from following the normal path of unbalance force in a rotor.
by Diana Pereda
If one expects to start a “long term” investment in production equipment, and one expects to achieve maximally profitable long term Return on Investment (ROI), one should know that one must have a properly designed and constructed foundation. As is obvious, if one has foundation problems at home, one must spend a lot of one’s hard earned money to get things back in shape. Production equipment is no different; one can cheaply fix a lot of things with shortcuts and offhand tactics, but a machine foundation is not one of them.
Of all the things we have seen come back to haunt equipment owner/operators draining expected profits, foundation inadequacies (including the foundation itself and the base) are probably the worst. There simply is no shortcut to fixing a poorly designed or constructed foundation and base. This may seem to be an odd topic for a blog by a vibration analyst, but the author has diagnosed this particular problem from the observed machine vibration many times. Poor foundations/bases yield recurring misalignment, mechanical looseness, metal fatigue cracking, seal failures, and resonance problems, to name just a few.
Diagnosis of the problem is just the beginning of a serious journey to a real, solid, and reliable fix, that often sets the owner/operator back a considerable amount of money as more “affordable” band-aids are attempted, before finally biting the bullet and “fixing it right”. It turns out that although a good foundation and base are more expensive than flimsy ones, putting a good foundation and base under an already installed machine is many, many times more expensive. So, how do you save money correctly?
Just one example: Perform “acceptance testing” vibration analysis on pumps and fans in particular. This may reveal problems in advance. Because once you’ve “accepted” it, ‘it’ is your machine, for better or worse. A bit of well-directed scrutiny up front will often save a lot of money later, especially in terms of major headaches over unscheduled downtime.
The foundation is not the first thing one thinks about when considering the need for new equipment, but if one doesn’t consider and build it correctly, it will be something one has to think about again and again.
by Diana Pereda
What is the difference between Brinelling and False Brinelling? What causes Brinelling and False Brinelling?
Brinelling
Brinelling is named after the Brinell scale of hardness. In the Brinell hardness test, a small ball is pressed into the surface of a material using a specific amount of force. The size of the indentation that occurs in the material is a measure of its hardness. Brinelling is an indentation in the surface of a material; a permanent plastic deformation that occurs when the yield strength of the material has been exceeded.
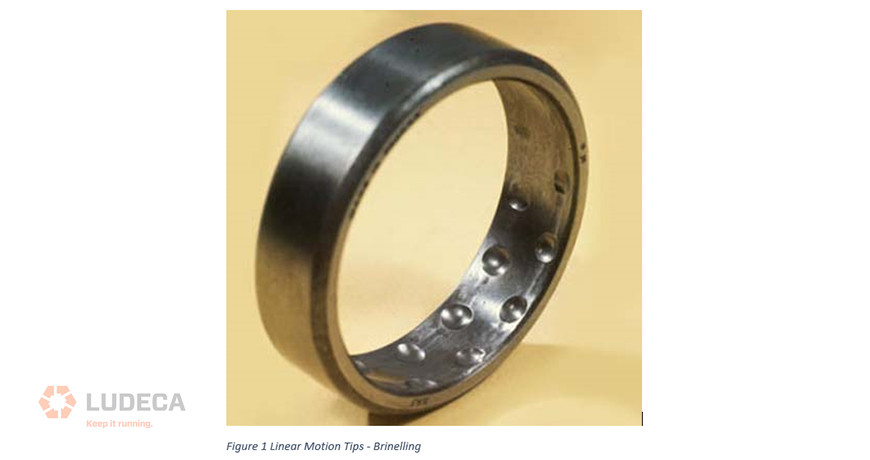
Brinelling can occur in rolling element bearings when large static loads cause the balls or rollers to create indentations on the race; usually spaced the same distance apart as the balls or rollers. It can also be caused by a single impact or a repeated impacting. The main point is that the forces of the balls against the race exceed the yield strength of the material and result in a permanent dent. These excessive forces may occur during transportation, in storage, or during the bearing installation process. Special care must be taken when pressing or clamping bearings to avoid causing damage.
False Brinelling
False Brinelling in a stationary bearing creates a similar pattern of marks on the race separated by the distance between the balls or rollers. This wear pattern is called “fretting.” False Brinelling occurs when vibration pushes the oil out of the contact surface between the balls or rollers and the race. The loads in this case are not enough to cause permanent damage or indentations in the race, but the polishing of the race surface causes it to look like Brinelling – hence the name “false brinelling.” Because the races are polished by surface-to-surface contact in the absence of oil but are not actually damaged, the wear pattern will disappear after a short break in period.
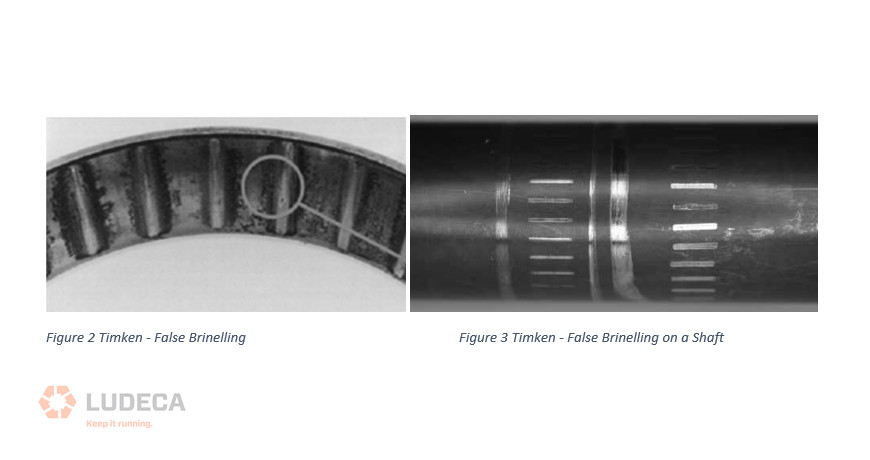
False Brinelling in a stationary bearing often occurs during transportation of bearings or when they are in storage if they are subjected to vibration from trains or forklifts passing by or other sources of vibration. It is also common in standby machines if they are not isolated from the vibration coming from other machines running nearby.
It’s also possible for false brinelling or fretting to occur in rotating bearings if the rotational speed causes the balls or rollers to make contact with only specific parts of the races over and over again. This causes a similar wear pattern however in this case the distance between the wear marks will not match the distance between the balls or rollers.
Take Care of Your Bearings!
The proactive approach to bearing care includes being careful about how bearings are shipped, stored, and installed. Brinelling and False Brinelling can be avoided by using correct packaging, rotating stationary shafts, and storing bearings in cabinets that are mounted on vibration isolators and that have damping material on the shelves.
WANT TO LEARN MORE?
Alan Friedman dba Zenco offers machinery vibration analysis courses and certification in accordance with ISO 18436-2. Click here to check out his course schedule, you can also connect with him on Linkedin. In addition to public classroom training and public virtual courses, Alan is also available for private courses virtually or on-site in addition to informal training and mentoring. Category I and II vibration are also available in Spanish.
Alan, aka the Vibe Guru, has over 30 years of vibration analysis experience, He has trained thousands of students around the world up to Category IV. One of the things that makes Alan a great teacher is his ability to teach people where they are at. Whether you are a math-challenged millwright, an engineer, or a PhD, Alan will challenge you without overwhelming you. If you are interested in condition monitoring you can also check out his book: Audit It. Improve It! Getting the Most from your Vibration Monitoring Program or hire him for an on-site program audit.
by Ana Maria Delgado, CRL

Introduction
Large commercial chillers are the backbone of many facilities, supplying thousands of tons of cooling through extensive piping networks. But even when the equipment itself is built to last, the structures that support it may not be.
During routine vibration data collection, our team identified excessive vibration not on the chiller, but on the piping support structure tied into the system. Follow-up testing confirmed the cause: resonance. This wasn’t a threat to the chiller itself, but to the facility structures that keep the chilled water system in service.
The Setup
The facility operates six chillers connected to a common chilled water header. The newest unit, a Trane 862 kW (≈1,156 HP) chiller operating at 4160 V and 3570 RPM, was piped into the header alongside the existing chillers. The chilled water lines are supported on heavy H-beam steel mounts.
While the supports appeared substantial, vibration monitoring revealed otherwise.
The Discovery
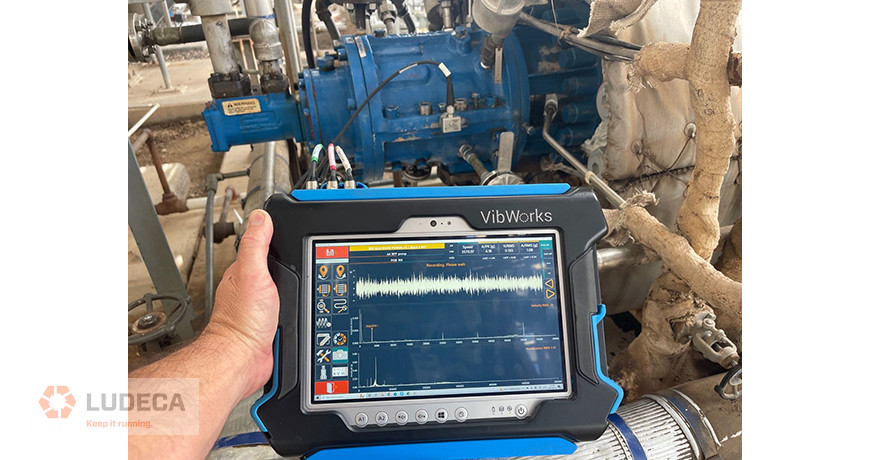
Routine data collection was performed with a Betavib King vibration analyzer using a TREA330 premium CTC Triax accelerometer, along with CTC cables and magnets.
The analyzer showed that while the chiller itself was operating normally, the piping supports were vibrating excessively. This triggered a deeper investigation.
To confirm the root cause, we conducted impact testing using the same Betavib analyzer with a single CTC AC192-1D accelerometer. The results showed that the H-beam supports had a natural frequency of ~59–60 Hz — nearly identical to the chiller motor’s operating speed of 3570 RPM (59.5 Hz).
When the chiller was online, vibration at the top of the support frame reached about 0.7 in/s peak at 1× running speed. Amplitudes increased from bottom to top, showing that the structure was resonating in its first bending mode.
Why Resonance Matters
It’s important to understand: the chiller itself was not in danger. Rotating equipment is designed to operate at 3570 RPM continuously.
The real risk lies in the facility structures being forced to vibrate at that same frequency. At 0.7 in/s peak, the piping supports were experiencing vibration levels high enough to cause long-term structural problems if left uncorrected.
This level of motion, repeated 60 times per second, can lead to:
- Piping chafing against the steel mounts, wearing through insulation, coatings, and eventually the pipe wall
- The risk of a hole in chilled water piping, leading to a catastrophic facility flood
- Fatigue cracks in welds and anchors
- Loosened hangers and piping supports
- Leaks at flanges and nozzle connections
“It’s not the chiller that fails — it’s the facility around it.”
Mitigation Strategies
To protect the facility, corrective actions must address the structural resonance:
- Stiffen the support structure — add gussets, cross-bracing, or tie-backs to raise the natural frequency above ~75 Hz.
- Add damping — apply constrained-layer damping or viscoelastic pads to reduce peak response.
- Install a tuned mass damper (TMD) — placed near the top of the frame, tuned to ~60 Hz, to absorb vibration energy.
- Isolate the piping — with spring hangers or isolators (within nozzle load limits).
- Minimize excitation — alignment and balance checks can help, but the primary driver here was structural resonance.
Lessons Learned
This case highlights the value of routine vibration monitoring with professional-grade equipment. The Betavib King analyzer with CTC Triax sensors identified the abnormal piping vibration that visual inspection could not. Follow-up impact testing with the CTC AC192-1D accelerometer confirmed the resonance problem.
The key lesson: resonance doesn’t damage the chiller — it damages the facility around it.
To avoid that risk:
- Collect routine vibration data on both equipment and connected structures.
- Perform impact testing when abnormal motion is detected.
- Ensure piping supports are designed with natural frequencies well clear of motor running speeds and harmonics.

Conclusion
Routine data collection with the Betavib King analyzer revealed that the piping supports for a Trane chiller were resonating with its operating speed. Left uncorrected, this resonance could lead to pipe chafing, fatigue, and even a catastrophic flood — not because the chiller failed, but because the supporting structures could not withstand resonance.
By detecting the problem early, corrective action can be taken before the facility suffers costly downtime. As chillers grow larger and more powerful, vibration management must extend beyond the machines themselves to the structures that carry their loads.
Thank you Brian Franks with JetTech Mechanical LLC for sharing this informative article with us!
Understanding the consequences that resonance has on equipment reliability
by Diana Pereda

1. Introduction
A large number of condition monitoring (CM) programs fail—not because vibration monitoring is ineffective, but because managers and decision-makers lose confidence in the systems they install. Too often, these systems either fail to detect real faults or generate excessive false alarms.
The root cause is usually the same: organizations are misled by overpromises about limited solutions. Many believe that simply tracking overall vibration levels—such as:
- Acceleration Peak (Acc Peak)
- Acceleration RMS (Acc RMS)
- Overall Velocity RMS (per ISO standards)
is enough to guarantee the success of their investment. In practice, it is not. These indicators are quick to calculate, easy to trend, and provide a general overview of machine behavior. They are useful as first-level alarms, but on their own, they cannot ensure reliable fault detection.
After such disappointing trials, companies often become reluctant to reinvest, missing the opportunity to benefit from advanced monitoring.
This article is meant to clarify why simply “collecting vibration” is not the same as tracking every single change in dynamic behavior, and why relying only on overall levels inevitably leads to blind spots. By understanding these limitations, decision-makers can make informed choices about technologies that deliver real reliability and measurable return on investment.

2. The Mask Effect and Its Consequences
The mask effect occurs when one vibration source generates high amplitude and hides other components of the signal within the overall value. This can lead to a dangerous situation where the machine appears stable, while in reality new faults are developing.
Typical Scenarios of Masking:
- Dominant low-frequency phenomena: A strong unbalance at the shaft’s rotational frequency can dominate the overall RMS, masking misalignment, looseness, or early-stage bearing faults.
- High-frequency masking: When high-frequency components—such as gear mesh frequencies (GMF), bearing defect frequencies (BPFO/BPFI), or resonance excitations—are present, their high amplitude can increase the overall RMS tenfold. In such cases, the indicator becomes “blind” to changes in low or mid-frequency ranges.
- Resonance amplification: Structural resonances may generate very high peaks that saturate overall acceleration RMS, again hiding subtle changes in machine behavior.
As a result, overall levels cannot guarantee reliable fault separation or early detection, particularly when multiple phenomena coexist.
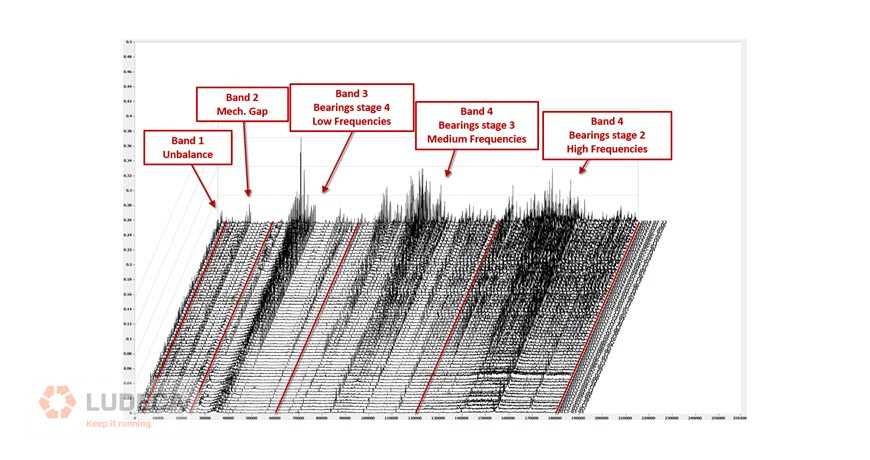
The following experimental data coming from real assets clearly demonstrates how standard overall vibration levels are not capable of detecting the change in the dynamic behavior of the monitored asset, not to mention detecting a health issue affecting the equipment.
While proper knowledge of the failure mechanism correlated with the right tools that VibWorks King is, it’s easier to notice that for the exact same machine and under the same timespan (6 years), the assets triggered danger levels 4 times, and was safely repaired during scheduled shutdowns.

3. The Right Solution: Power-in-Band Monitoring
Looking at overall RMS values is a bit like taking a photo with the wrong lens:
- If you only use a wide-angle lens, you capture the whole scene, but you miss the details—small cracks, fine textures, or subtle movements are invisible.
- Similarly, overall vibration levels (Acc Peak, Acc RMS, Velocity) give you the big picture of the machine, but they blur out the details of specific faults.
To truly understand what is happening inside the machine, you need the right focal length—the right “zoom” on the right part of the spectrum. This is exactly what power-in-band monitoring provides.
By splitting the vibration spectrum into a certain number of frequency bands, each “lens” focuses on a different fault mechanism:
- Unbalance Band – like zooming on the main subject (1× speed).
- Misalignment Band – the next focal range, catching distortions you’d miss with the naked eye.
- Mechanical Gaps Band – exposing looseness and coupling play hidden in the background.
- Bearings Low-Frequency Band – a macro lens for cracks and spalls appearing at low frequencies.
- Gear Mesh / Bearings High-Frequency Band – a telephoto lens capturing fine details of GMF and early bearing fatigue.
- Lubrication Band – a high-speed lens revealing subtle friction and micro-impacts invisible in a normal shot.
With this approach, each band acts like a dedicated lens for a specific phenomenon. No one effect can blur or hide another. You can “zoom in” on any change in dynamic behavior and capture a crisp picture of the machine’s condition.
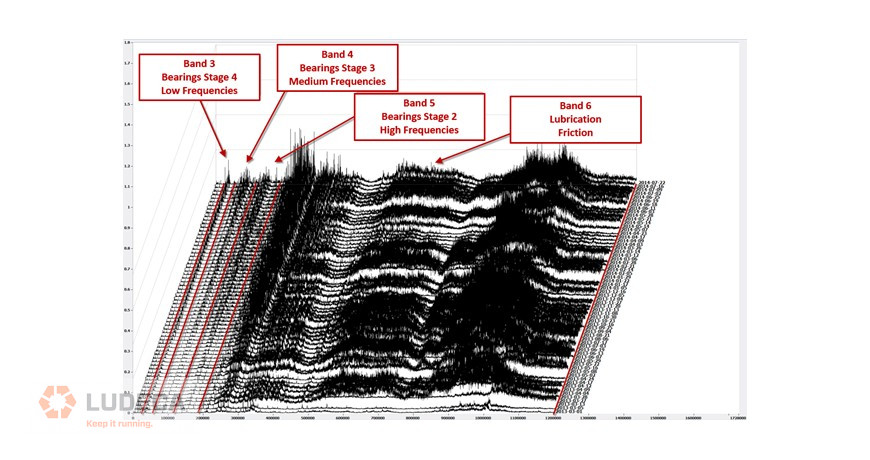
4. Benefits of 6-Band Monitoring
By separating the vibration spectrum into these six bands, the monitoring system can:
- Isolate phenomena: Each physical defect mechanism is tracked independently (harmonics, shocks, friction, looseness, etc.).
- Eliminate masking: No single phenomenon can hide another—changes are visible even if overall RMS remains constant.
- Enable early detection: Slight variations in dynamic behavior are immediately identified.
- Improve reliability: Maintenance teams can intervene earlier, with clearer diagnostics and lower costs.
5. Conclusion
Overall vibration levels (Acc Peak, Acc RMS, Velocity ISO) are a convenient first step, but they are like a blurry snapshot—limited by the mask effect, especially when high-frequency components or resonances dominate.

The solution is power-in-bands monitoring, where each band acts as a dedicated lens focusing on a specific fault type. Instead of a single blurred picture, you get a complete professional photo album of the machine’s health: sharp, detailed, and unambiguous. This approach provides a full and reliable view of machine dynamics, eliminates blind spots, and enables confident, proactive maintenance decisions.
Thank you Betavib for sharing this valuable article with us!
4 Common Vibration Issues that are Easily Detected to Extend Equipment Reliability
by Diana Pereda
A shaft centerline diagram is a plot used in the vibration analysis of journal bearings. It is also called a shaft average centerline diagram. The purpose of this graph is to display the average position of the rotor in the bearing. In short, for different bearing types, there is an expected or “normal” position of the shaft in the bearing. If this position changes, it can indicate a problem.

Figure 1 above shows two mass-spring systems vibrating at the same amplitude and frequency. They are, however, vibrating around different points, (the horizontal dashed black lines.) You can think of the shaft centerline diagram as the point the shaft is vibrating around.
If the blue wave in the figure above was electricity, it would be an alternating current (AC). This is what the AC output of a vibration sensor would look like if it was measuring the vibration of the mass in the figure. If you look at the black dashed horizontal lines, this looks like direct current (DC) voltage. The proximity probes used to measure the shaft centerline diagram put out both an AC and DC component. Because we are interested in position rather than vibration in this plot, we only keep the DC component. This is called DC coupling.
Proximity Probes
One typically uses two proximity probes, also called eddy current probes, when monitoring a journal bearing. The probes are permanently installed and mounted 90 degrees from each other (Figure 2). This gives us a two-dimensional view of the shaft’s position in the bearing. The AC voltage from these probes is used to measure shaft vibration and is often displayed in a 2D plot called an orbit. Figure 3 shows the relationship between the shaft centerline and the orbit. You can think of the centerline as the point the shaft is orbiting about.
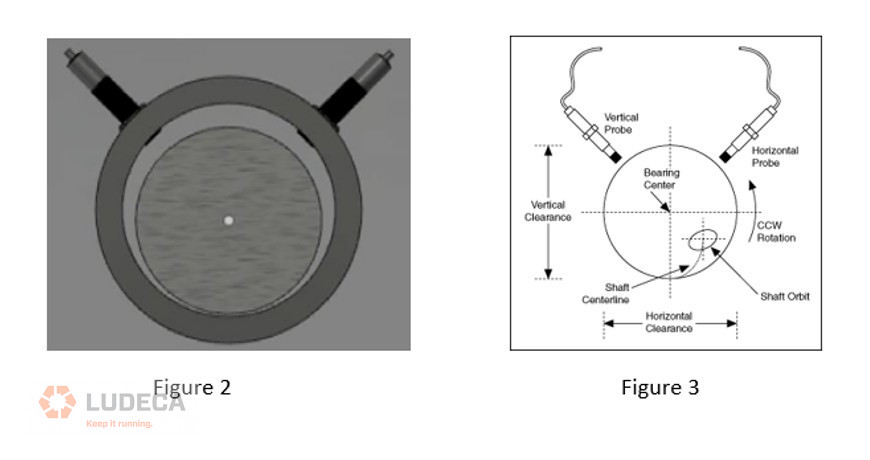
As a shaft is run up in speed, the rotating shaft forces the oil to form a wedge in the bearing (Figure 4). The rotor will then sit on this oil wedge as it rotates around. Figure 5 is the shaft centerline diagram. The blue numbers on the plot are shaft RPM. The red line shows how the center point of the shaft has moved as the machine is sped up to running speed. In this case, up and a little to the right, which is normal for a tilt pad bearing rotating counterclockwise. Figure 6 shows an abnormal centerline plot where the rotor is too far to the right edge of the bearing. This could be the result of misalignment.
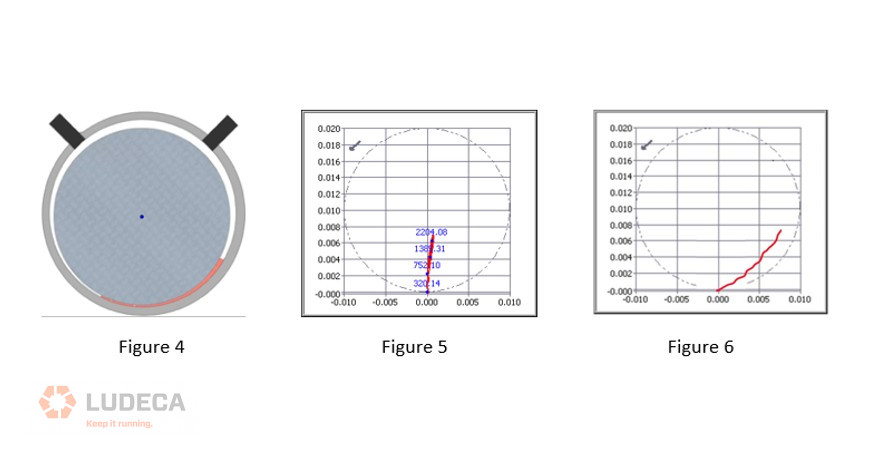
The shaft centerline plot is essential for journal bearing monitoring. Abnormal rotor positions can indicate all sorts of problems. This plot should be routinely measured and analyzed when monitoring journal bearings.
WANT TO LEARN MORE?
Alan Friedman dba Zenco offers machinery vibration analysis courses and certification in accordance with ISO 18436-2. Click here to check out his course schedule, you can also connect with him on Linkedin. In addition to public classroom training and public virtual courses, Alan is also available for private courses virtually or on-site in addition to informal training and mentoring. Category I and II vibration are also available in Spanish.
Alan, aka the Vibe Guru, has over 30 years of vibration analysis experience, He has trained thousands of students around the world up to Category IV. One of the things that makes Alan a great teacher is his ability to teach people where they are at. Whether you are a math-challenged millwright, an engineer, or a PhD, Alan will challenge you without overwhelming you. If you are interested in condition monitoring you can also check out his book: Audit It. Improve It! Getting the Most from your Vibration Monitoring Program or hire him for an on-site program audit.
by Diana Pereda

As wireless sensors are starting to become mainstream in the condition monitoring world, there are now many more choices to consider when selecting a system to fit your needs. This tip aims to look at the key features that will impact your decision. When purchasing your next wireless system, quiz your supplier using the information below.
Data Captured
Not all wireless sensors are created equal. Some will only capture an OA, or Overall Value, which is a single number indicative of the amount of vibration measured at the sensor. OA is useful for detecting certain types of faults, but it will not assist in diagnosing the problem, or inform the user of how severe the potential issue is. The good news is that there are a lot of sensors on the market that capture a full time waveform, TWF. This waveform can be transformed into a spectrum revealing the energy associated with the underlying frequencies. Using both a TWF and Spectrum is a reliable tool for diagnosing faults.
One step better is a sensor that will capture both an OA value regularly, and a TWF periodically – ensuring both a timely and informative strategy.
Fmax
This is the maximum frequency your sensor will capture, higher values allow for detecting faults on higher speed machines, or on very low speed machines (providing the sample window is sufficient). The general rule of thumb is Fmax = 70 x Running Speed. As the vast majority of wireless sensors are tri-axial, you should ensure you are aware of the Fmax for each axis, as you may only need a high Fmax reading in one axis.
Installation and Maintenance
Ease of installation is a huge area for wireless sensors. Does the sensor and gateway come pre-linked? How do you connect a new sensor to a gateway? Can you easily swap a sensor should one need replaced? Ask your supplier to show you a typical installation so you understand the time involved.
Wireless Technology & Range
There are numerous wireless technologies available, but make sure you are aware of the pros and cons of each before choosing your supplier. WiFi and Bluetooth (both 2.4GHz) are very common and easy for most to understand, but their range can be limited when used in an industrial environment, furthermore, some factories control their entire plant using 2.4GHz and will simply not allow the addition of more transmitters on that frequency.
Other technologies such as LoRa and ISM will utilize sub-1GHz bands and will not interfere with existing equipment. They also benefit from better propagation through certain materials due to their lower frequency, meaning better range for similar battery life – with less existing equipment on this band, it will trouble IT teams much less.
Battery
There’s no point having a wireless sensor if it’s powered via cables – thus most, if not all, wireless sensors are battery powered. You will find two key options, non-replaceable and replaceable.
Non-replaceable batteries will benefit when it comes to ingress protection and intrinsic safety. As the sensor will not be user serviceable, it greatly increases robustness. Replaceable batteries increase the useable life of the sensor – but be aware of misleading claims from manufacturers quoted battery life, as it can typically only be achieved when the sensor is in a low power state and limited use mode – ask your sensor supplier for the true battery life for your given application. The more times you have to replace a battery, the greater cost to you, mostly for the time it takes to replace (on average $100 per sensor), so higher battery life is better, even for replaceable battery.
Thank you, David Proctor, with Sensoteq for sharing this educational blog with us!
by Diana Pereda
In Are Harmonics Real? Part 3, I offered some examples of resonance where the natural frequencies of a system are also harmonics. This is not the norm for most objects, but it is was worth mentioning to avoid confusion.
What Does LinkedIn Think?
I asked the LinkedIn community what they think about this question, both before and after writing my articles. It seems I did not do a very good job of changing minds! The poll below still had 5 days to run, the sentiment is clear. That said, this is in no way a scientific poll. I did not ask the same people for their opinions before and after reading the articles. Many thousands read the articles and only 114 answered the poll. I also have no way of knowing if the people who responded to the poll actually read any of the articles.
I argued for many years that harmonics are NOT real, so I certainly can see why intelligent people might still think that (even though I proposed some simple experiments in these articles to prove that they are in fact real!)

What Do Our AI Overlords Have to Say About It?
They say the AIs are going to replace us, so I thought I would survey a few LLMs to see what they had to say on the subject.
Question 1: A clipped wave will produce harmonics in the FFT. Are the harmonics “real” or are they just a product of the FFT algorithm?
CoPilot
The harmonics observed in the FFT of a clipped wave are indeed “real” in a mathematical and physical sense. When a wave is clipped, the process introduces sharp transitions or discontinuities, effectively altering the waveform. These abrupt changes result in the addition of high-frequency components that were not present in the original signal. The Fourier Transform (FFT) mathematically represents the wave as a sum of sinusoids, so it picks up on these newly introduced frequency components—these are the harmonics you see.
In other words, the harmonics are not artifacts of the FFT algorithm itself; they are genuinely present due to the clipping process. The FFT just reveals them. Clipping is a type of non-linear distortion, and harmonics are a natural byproduct of such distortions in signal processing.
Gemini
The harmonics produced in the FFT of a clipped wave are real, not just a product of the FFT algorithm. Here’s why:
- Clipping introduces non-linear distortion: When a waveform is clipped, its shape is fundamentally altered. This abrupt change in the time domain signal introduces new frequency components that were not present in the original, unclipped signal.
- Harmonics are inherent to non-sinusoidal periodic waveforms: Any periodic waveform that isn’t a pure sine wave is composed of a fundamental frequency and its harmonics (integer multiples of the fundamental frequency). Clipping a sine wave forces it to become a non-sinusoidal, albeit distorted, periodic waveform.
- The FFT reveals existing frequency content: The Fast Fourier Transform (FFT) is a mathematical tool that analyzes a time-domain signal and decomposes it into its constituent frequencies. It doesn’t invent frequencies; instead, it reveals the frequencies that are already present in the signal.
- Experimental verification: You can observe these harmonics using a spectrum analyzer (which essentially performs an FFT in hardware). The presence of harmonics after clipping is a physically measurable phenomenon, not an artifact of the FFT process itself.
- Think of it this way: Clipping adds energy to the signal at specific harmonic frequencies due to the waveform distortion. The FFT accurately identifies and quantifies these newly generated frequency components. While the FFT algorithm itself has certain characteristics and potential artifacts (like spectral leakage or aliasing if not used correctly), the harmonics seen in the FFT of a clipped wave are a genuine representation of the altered frequency content of the signal caused by the clipping process.
DeepSeek
When a waveform is clipped (either hard or soft clipping), the resulting distortion introduces real harmonics into the signal. These harmonics are not just artifacts of the FFT algorithm but are physically present in the time-domain signal due to the nonlinear distortion caused by clipping.
Why Are the Harmonics Real?
- Mathematical Basis (Fourier Series/Transform)
- Nonlinear Distortion Mechanism
- FFT as a Measurement Tool
Practical Confirmation
- If you observe a clipped sine wave on an oscilloscope, you can clearly see the flattening (hard clipping) or smoothing (soft clipping).
- A spectrum analyzer (which doesn’t use an FFT) would still show the harmonics.
- Analog systems (e.g., guitar distortion pedals) produce these harmonics without any digital processing.
Conclusion
The harmonics produced by clipping are real and not an artifact of the FFT. The FFT merely reveals them as part of the signal’s true frequency content.
Question 2: As a follow-up to the last question. Let’s say the fundamental frequency of the clipped wave is 30 Hz. The clipped wave is measured on a vibrating table. If I attach a spring with a natural frequency of 60 Hz to the table, will it resonate?
CoPilot
Resonance occurs when the frequency of an external driving force matches the natural frequency of the system—in this case, the spring’s natural frequency of 60 Hz. The fundamental frequency of the clipped wave is 30 Hz, which is half the spring’s natural frequency. However, the harmonics generated by the clipping process could include a frequency component at 60 Hz, depending on how the waveform is distorted.
If the 60 Hz harmonic is present in the vibration caused by the clipped wave, the spring could potentially resonate. This is because resonance doesn’t solely depend on the fundamental frequency—it can also be driven by harmonic components of the waveform that match the spring’s natural frequency.
To test this, you would need to analyze the FFT of the clipped wave to confirm the presence of a 60 Hz harmonic. If it exists and has enough energy to excite the spring, resonance is a plausible outcome.
Gemini
Yes, the spring with a natural frequency of 60 Hz will likely resonate, although the strength of the resonance will depend on several factors. Here’s the breakdown:
- Harmonics are present: As we discussed, clipping a 30 Hz wave introduces harmonics, which are integer multiples of the fundamental frequency. One of these harmonics will be at 60 Hz (the second harmonic).
- Resonance occurs at the natural frequency: Resonance is the phenomenon where a system (in this case, the spring) vibrates with maximum amplitude when driven by an external force at or near its natural frequency.
- The 60 Hz harmonic acts as a driving force: The vibrating table, driven by the clipped 30 Hz wave, will contain a significant component at 60 Hz due to the clipping. This 60 Hz component will act as a periodic driving force on the attached spring.
- Matching frequencies lead to energy transfer: When the driving frequency (the 60 Hz harmonic from the table) matches the natural frequency of the spring (60 Hz), energy will be efficiently transferred to the spring, causing it to oscillate with a larger amplitude – this is resonance.
In conclusion: Because clipping introduces a harmonic at 60 Hz, which matches the natural frequency of the spring, you can expect the spring to resonate.
DeepSeek
Yes, the spring with a natural frequency of 60 Hz will resonate if the clipped wave contains sufficient energy at that frequency (the 2nd harmonic). Here’s why:
- Harmonics in a Clipped Wave
- A clipped wave (hard or soft clipping) generates real harmonics at integer multiples of the fundamental frequency (30 Hz).
- The strongest harmonics are typically the odd-order (90 Hz, 150 Hz, etc.), but even-order harmonics (60 Hz, 120 Hz, etc.) are also present, especially in asymmetrical clipping.
- Resonance Condition
- Resonance occurs when a system’s natural frequency matches an excitation frequency.
- If the clipped wave has a 60 Hz component (2nd harmonic), and the spring has a natural frequency of 60 Hz, it will resonate if:
- Will the Spring Resonate?
- Yes, if: The clipping is severe enough to produce a measurable 60 Hz harmonic. The system has low damping (e.g., a lightly damped spring).
- No or weakly, if: The clipping is mild (weak harmonics). The system is heavily damped. The wave is symmetrically clipped (which suppresses even harmonics, leaving mostly odd ones like 90 Hz).
Practical Consideration
- If the clipped wave is symmetrical (e.g., centered around zero), the even harmonics (60 Hz, 120 Hz, etc.) will be weaker or absent, meaning resonance at 60 Hz may not occur.
- If the clipping is asymmetrical, even harmonics will be stronger, increasing the chance of resonance at 60 Hz.
- You could verify this by running an FFT on the vibrating table’s motion to see if 60 Hz is present.
Conclusion
Yes, the spring will likely resonate at 60 Hz if the clipped wave contains enough energy at that frequency. The presence of even harmonics depends on the clipping symmetry, but in many real-world cases, some 60 Hz content will exist, leading to resonance.
Conclusion
LinkedIn poll answering community Vs LLMs? I’m going to side with the LLMs on this one! I want to reiterate that I spent a number of years arguing that harmonics are NOT real before I changed my mind. I also want to note that I wrote the articles on this topic BEFORE I asked the LLMs to weigh in.
Still not convinced? Why not try the experiments I proposed in the article and see for yourself? If you have an 1800 RPM motor, put a spring on it that is tuned to 60 Hz (2x) and see if it vibrates. If the 2x harmonic is not real, the spring will not vibrate. Or, hit a bell with a mallet and see if it rings. If the hit does not contain the natural frequencies of the bell, the bell will not ring.
You might also query the LLMs yourself and look at the sources they cited to come to their conclusions.
WANT TO LEARN MORE?
Alan Friedman dba Zenco offers machinery vibration analysis courses and certification in accordance with ISO 18436-2. Click here to check out his course schedule, you can also connect with him on Linkedin. In addition to public classroom training and public virtual courses, Alan is also available for private courses virtually or on-site in addition to informal training and mentoring. Category I and II vibration are also available in Spanish.
Alan, aka the Vibe Guru, has over 30 years of vibration analysis experience, He has trained thousands of students around the world up to Category IV. One of the things that makes Alan a great teacher is his ability to teach people where they are at. Whether you are a math-challenged millwright, an engineer, or a PhD, Alan will challenge you without overwhelming you. If you are interested in condition monitoring you can also check out his book: Audit It. Improve It! Getting the Most from your Vibration Monitoring Program or hire him for an on-site program audit.
Case Study: Eliminating High Vibration Due to Natural Frequency
by Diana Pereda

How do you read this? Well, that depends on who you are and what your position is in your organization. If you are an area owner and this is one of your critical machines, then you’ll probably be really happy. Readings are being taken and everything looks good. The actual alert and alarm limits, enveloped spectrum alarms, high-frequency detection-that’s all been taken care of by the reliability department.
On the other hand, if you’re a technician and it’s your job to take these readings with a hand-held data collector, this trend can be described with one word – boring. While there is always value in taking a reading on a rotating asset and using your 5 senses to look for issues that might not be picked up with vibration, this only extends so far for machines that rarely have issues. For AHUs with sensors already mounted and cabled to the outside with BNC connections, you’re not even using the 5 senses. The most difficult part of the job is keeping your concentration and matching the asset in the route to the asset you are at. This has to compete with your attention span which might drift to what you’re going to have for dinner tonight or what you might watch on Netflix after. The technicians of today are hungry to learn and want to be as much a part of Industry 4.0 as anybody else. They will naturally gravitate to work that is interesting and challenges their grey matter. Taking readings on AHUs does not do this, especially if they are not involved in the analysis.
So, if you already have sensors on your AHUs, why not go the extra mile and stick a transmitter on the outside and send all that data up to the cloud. The reliability team are then not limited to one reading a month to figure out what’s actually going on. If you have your sensors on process equipment, then you can not only look at data related to machinery diagnostics, you can export your overall trend into a data analytics package and overlay vibration against pressure, tank levels, valve states, flow rates. Maybe your pump is dead-heading against a manual valve that has no feed-back. Maybe it’s pumping against a partially closed control valve that is choking flow so the system can come up to temperature. This would then result in increased axial vibration, possibly over the alarm limits, that would then prompt an analyst to recommend a pump check, focusing on the coupling. In reality, this will be a temporary rise in vibration and by the time the technician gets there, will probably be passed. Maybe it’s being fed from a tank and the low-level interlocks aren’t working so it’s cavitating. Take it one step further and you can look at flow-induced vibration from where the system curve intersects the flow curve for different flow rates. A whole new world opens up.
To do this, you’ll need to think of systems as opposed to just individual assets. P&IDs, dampers, control valves, tank levels, flow rates-all the information from this instrumentation will form part of your assessment as opposed to just drive end and non-drive end vibration. This scenario is coming to an organization near you, whether you like it or not. You just have to decide if you want to be a part of it.
Thank you Sensoteq for sharing this educational article with us!
by Diana Pereda
In Are Harmonics Real? Part 2, I suggested that a single hit or impulse can be thought of the same way. If a tuning fork has a natural frequency of 60 Hz, it will not make a sound unless it is excited at 60 Hz. It does however make a sound when you strike it against your hip. This means that the single strike or single impulse must contain “real” vibration at 60 Hz. Although I did not hit the tuning fork 60 times per second, the single impulse “contains” that frequency. It is not just a by product of the FFT.
Non Linearity
Why are there frequencies in the output that do not exist in the input? If I bounce the mass on the spring up and down at 30 Hz, why do I also get frequencies at 60, 90, 120 Hz Etc? The answer is non-linearity. In a non linear system you get things in the output that were not present in the input. You can read more about that in my article, Linear and Non-linear Vibrations.
An Example of Harmonics that are Real in a Different Way
There are a couple of interesting cases where harmonics are “real” in a different way. I’ll give you a hint: We like the sound of harmonics.
If you have a string connected at both ends, like a guitar string, the modes or natural frequencies are also harmonics. If for example the first mode or natural frequency is 30 Hz, the 2nd will be 60 Hz and the 3rd 90 Hz etc. The reason for this is that the modes break up the space into equal divisions create a pattern of “standing waves” whereby the vibration reinforces itself. If the wave shape doesn’t perfectly fit, the waves will be out of phase and will cancel out.

This is NOT true for most structures!!! In a bell, the first natural frequency might be 30 Hz, the 2nd might be 97.3 Hz and the 3rd might be 104.8 Hz. In other words, in most structures, the modes are NOT harmonics of each other.
Can you Think of Another Example?
Can you offer another example where the modes or natural frequencies are also harmonics? I gave you a hint that we like the sound of harmonics.
The other example is a tube filled with air – as in a pipe organ. In this case, the sound waves in the air bounce off then ends of the pipe. The wavelengths that perfectly fit in the space or that perfectly divide it up, will reinforce themselves. Those that don’t perfectly fit in the space will bounce back out of phase and will cancel each other out.
The fundamental frequency and harmonics generated by a pipe organ are therefore related to the length of the tube.
Keep your eyes open for another article in thus series where we’ll see what out AI overlords have to say about the reality of harmonics. In the meantime…
WANT TO LEARN MORE?
Alan Friedman dba Zenco offers machinery vibration analysis courses and certification in accordance with ISO 18436-2. Click here to check out his course schedule, you can also connect with him on Linkedin. In addition to public classroom training and public virtual courses, Alan is also available for private courses virtually or on-site in addition to informal training and mentoring. Category I and II vibration are also available in Spanish.
Alan, aka the Vibe Guru, has over 30 years of vibration analysis experience, He has trained thousands of students around the world up to Category IV. One of the things that makes Alan a great teacher is his ability to teach people where they are at. Whether you are a math-challenged millwright, an engineer, or a PhD, Alan will challenge you without overwhelming you. If you are interested in condition monitoring you can also check out his book: Audit It. Improve It! Getting the Most from your Vibration Monitoring Program or hire him for an on-site program audit.
by Diana Pereda
In Are Harmonics Real? Part 1, I noted that a sine wave, perhaps created by a mass on a spring bouncing up and down, results in a single peak in the spectrum. If the spring gets more rigid as it gets compressed, the mass will move less in one direction than the other. We can describe the form of the wave this makes as distorted or clipped. When we pass this clipped wave through the FFT, we get harmonics or multiples of the fundamental frequency.

For example, if the mass bounced up and down 30 times per second, we would see a peak in the spectrum at 30 Hz. If it was clipped, we would also see peaks at 60, 90, 120 and 150 Hz etc. These are called harmonics. The question I posed is: Are the harmonics real? In other words, although the mass is still only bouncing up and down 30 times per second, is there actually real vibration occurring at 60, 90 and 120 Hz Etc? OR are these just artifacts of the FFT?
I posted this question to LinkedIn. Here are the responses:

Apparently, 65% of the respondents believe that harmonics are NOT real, but just a product of the FFT. Only 21% think harmonics are real. Perhaps popular opinion is not a good gauge of truth?
Natural Frequencies and Resonance
I am going to go off on a little tangent to talk about natural frequencies and resonance. In this tangent, I will propose an experiment that people can try themselves to prove if harmonics are real or not.
A single mass spring system has a single natural frequency. If you pull the mass down and let it go, it will vibrate at this frequency. A tuning fork is the same. It has one primary frequency it likes to vibrate at. A bell has numerous natural frequencies, but they also won’t ring if they are not excited by the same frequency.
A natural frequency is a property of the structure, related to its mass, stiffness and damping. Resonance is a condition where the natural frequency is excited by a forcing frequency. In the case of a tuning fork, it has a natural frequency, BUT if it is just sitting on a table, that natural frequency is not excited (it is not in resonance) and the tuning fork does not make a sound. If you shake it back and forth in your hand – Eg. vibrate it at a frequency other than its natural frequency, it also doesn’t make a sound. It only makes a sound when the natural frequency is excited.

This concept is very straight forward in vibration. I am not sure why the LinkedIn community got this wrong. If the natural frequency is NOT excited, the bell WILL NOT ring. On a positive note, I know where people can get some great vibration training! Y’all need it! 😉
A Single Impact
In Are Harmonics Real? Part 1, I noted that a single impact in time creates broadband noise in the spectrum. The FFT basically says: “Give me a wave and I’ll give you a bunch of sine waves. If you add these sine waves together, they will look like the original wave.” People who don’t think harmonics are “real” might say that they just come from the FFT trying to define the shape of the wave by adding sine waves together.
If you have a single impact in time, it looks nothing like a sine wave at all and the FFT spits out sine waves at lots of frequencies to try to define it. We call this broadband noise. People who believe that harmonics are not real will also believe the broadband noise is not real for the same reasons.
A single hit creates noise in the spectrum
Looking at the animation above. I am only tapping the structure once, but you see vibration all the way across the spectrum. There’s a hump just above 100 Hz, but I am not tapping anything 100 times per second. Therefore, this vibration must not be real. Right? I am also not tapping it 300 times per second and yet the spectrum shows vibration at that frequency (and all the frequencies between) as well.
I am asking the same question here. Is the broadband noise “real” or just an artifact of the FFT?
An Easy Experiment
I am using the example of broadband noise to make the case for harmonics being real because this one is more intuitive and easier to test. If you think harmonics are NOT real, you will also think broadband noise is NOT real for the same reasons. I am clearly only tapping the object once, not 100 times per second or 300 times per second or anywhere in between, so these frequencies must not be real… That’s how the thinking would go.
So, let’s say a bell or a tuning fork has a natural frequency of 1000 Hz. If you hit it once, does it ring at that frequency? Yes it does! That means that there really is vibration at 1000 Hz being input into the bell. That single tap does include real vibration at 1000 Hz. It is NOT just the FFT trying to come up with a bunch of sine waves that when added together will look like our input.
You could also prove that different “taps” include different frequencies, even if the tap itself only happens once. A drum head has a lot of natural frequencies – none of which will make a sound if it is not excited by the same frequency. If you hit a drum with a soft mallet, it makes a different sound than if you hit is with a wooden drum stick. Why is this? It is because the soft mallet only injects (or contains) lower frequencies and therefore only excites the lower modes or natural frequencies of the drum head. It makes a lower sound. A wooden drum stick injects lower and higher frequencies, so in addition to the low tones, you also get higher ones.
An Easy Experiment for Harmonics
With the last experiment in mind, we can prove the existence of harmonics in the same way. Let’s say we have the mass and spring bouncing up and down 30 times per second (30 Hz) but the wave is clipped due to the spring getting more rigid as it compresses. The FFT will contain 30 Hz and harmonics at 60, 90, 120 Hz etc.
To prove that the harmonics are “real,” we could attach another spring with a natural frequency of 60 Hz to the first spring. If the spring tuned to 60 Hz vibrates, it means there is in fact really vibration at 60 Hz, it is not an artifact or output of the FFT.
In the case of a machine, if it rotates at 1800 RPM (30 Hz) you could mount a spring on it with natural frequency of 60 Hz. If the spring vibrates, then there really is vibration occurring at this frequency.
Back in the old days (before my time) they had mechanical vibration sensors that were just a series of little masses on springs tuned to different frequencies. You placed it on a machine and looked to see which springs vibrated. This is how you knew which frequencies were present.
Non Linearity
Why are there frequencies in the output that do not exist in the input? If I bounce the mass on the spring up and down at 30 Hz, why do I also get frequencies at 60, 90, 120 Hz Etc? The answer is non-linearity. In a non linear system you get things in the output that were not present in the input. You can read more about that in my article below, Linear and Non-linear Vibrations.
Another Example of Harmonics that Real in a Different Way
In article 3, I’ll offer up a couple of cases where natural frequencies are also harmonics. Keep an eye out for it!
WANT TO LEARN MORE?
Alan Friedman dba Zenco offers machinery vibration analysis courses and certification in accordance with ISO 18436-2. Click here to check out his course schedule, you can also connect with him on Linkedin. In addition to public classroom training and public virtual courses, Alan is also available for private courses virtually or on-site in addition to informal training and mentoring. Category I and II vibration are also available in Spanish.
Alan, aka the Vibe Guru, has over 30 years of vibration analysis experience, He has trained thousands of students around the world up to Category IV. One of the things that makes Alan a great teacher is his ability to teach people where they are at. Whether you are a math-challenged millwright, an engineer, or a PhD, Alan will challenge you without overwhelming you. If you are interested in condition monitoring you can also check out his book: Audit It. Improve It! Getting the Most from your Vibration Monitoring Program or hire him for an on-site program audit.
by Diana Pereda

Are harmonics real or just an artifact or result of processing the waveform through the FFT? This is a question that comes up a lot among vibration analysts, or anyone working with signals and signal processing.
What Are Harmonics?
A sine wave has a single amplitude and frequency. Let’s say our sine wave has a frequency of 25 Hz and a peak amplitude of 10. If you use the FFT algorithm to convert a sine wave to a spectrum, you will see a single peak at 25 Hz with a peak amplitude of 10. You can see this at the beginning of the animation above. At the starting point there is a sine wave at the top and the spectrum below with a single peak at 25 Hz.
A wave that repeats itself but is not a sine wave results in harmonics in the spectrum. You can also see this in the animation above. As I clip or flatten the top of the wave, you can see the harmonics appearing in the spectrum. Harmonics are multiples of the base frequency. In this case they are 25 Hz x 2, 25 x 3, 25 x 4 etc. giving us peaks at 25 Hz, 50 Hz, 75 Hz, 100 Hz etc.
The Fast Fourier Transform (FFT)
The FFT is a tool that reveals the frequency components present in a signal. It breaks the signal down into a series of sine waves.
Another way of phrasing this is: The FFT essentially says “give me a wave and I will give you a bunch of sine waves. If you add all these sine waves together, it will look like the initial wave.” This is my layman’s way of understanding it anyway.
Each peak in the spectrum represents a sine wave. If I were to add the sine waves represented by the peaks at 25, 50, 75 and 100 Hz etc. at the end of the animation above, the resulting wave would look just like the clipped wave.
But Are Harmonics Real?
One view of this is that the wave I used for this explanation is not “real” in that it is something I generated in software. I also clipped it in software, so the peaks at 50, 75 and 100 Hz don’t correspond to anything real in the physical world, so they must just be artifacts or things stemming from running the data through the FFT. Right?
A Physical Representation of Clipping
Let’s say I move a mass and spring back and forth 30 times per second (30 Hz) with a sinusoidal force (a sine wave) but as the spring compresses, it gets more rigid and eventually stops compressing. This will create a clipped wave as in the image below. When I pull the mass out, it looks like a sine wave, when I push it in, compressing the spring, it gets flattened.
As we noted before, the clipped wave is repetitive but not a sine wave and therefore we will get harmonics. As you can see from the image above, we have peaks at 30, 60, 90 and 120 Hz.
One might look at this physical example of a clipped wave and they might say: “I see the mass moving back and forth 30 times / second. I do not see anything happening at 60 times per second or at 90 times per second, so harmonics can’t be real. They must just come out of the FFT algorithm.”
Repetitive Impacting
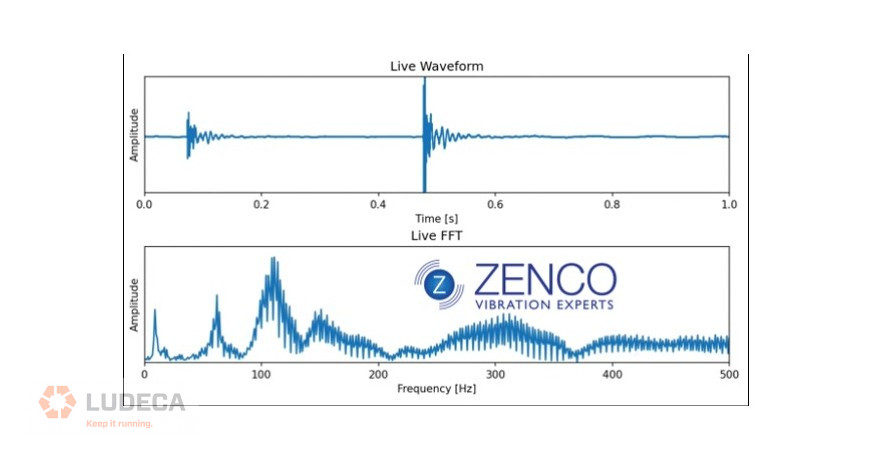
Another example of a wave that is repetitive but not a sine wave is repetitive impacts. If I take a drumstick and I hit a drum 5 times per second (as in the time waveform image below) I would see peaks in the spectrum at 5, 10, 15, 20 Hz etc. In other words, harmonics. Intuitively you know that you are only hitting the drum 5 times per second, so why would there be frequencies at 10, 15 and 20 Hz etc. in the spectrum? They must just come out of the FFT right?

The pattern above is common in machinery vibration analysis. This could be a bearing with a defect on the race and the impacts are the balls or rollers slamming into that defect one after the other. This could also a be a broken gear tooth that causes a big impact every time it comes into contact with the other gear. In both cases, the analyst would expect to see harmonics of the defect frequency in the spectrum.
A Single Impulse or Impact?
A common test in vibration analysis is to strike an object with a calibrated hammer. The calibrated hammer has a force sensor in its tip, so it measures the actual hit. If we look at this in the time waveform, we see a single sharp, short duration pulse. When we convert this pulse to a spectrum, we get vibration at many frequencies or what is referred to as “broadband” noise.
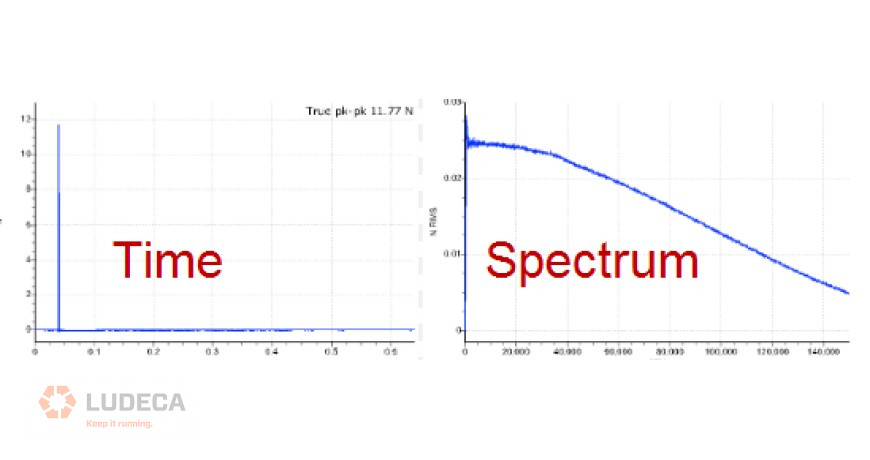
One might say: “The FFT has a really hard time describing that single impact by adding sine waves together. The only way to do it is to add sine waves together at every frequency as shown in the image above.” These frequencies don’t exist in the real world though. (Or do they?)
I will ask again, using this example, are the frequencies shown in the spectrum for this single impact “real?” Do they really exist? Or are they just a result of passing that data through the FFT and the FFT trying to describe it by adding sine waves together?
Conclusion to Part 1
I want to leave this as an open question for now. Take some time, think about it, and decide for yourself if you think harmonics (and broadband noise) are real or not. In upcoming articles, I will lay out a case for what I think. I will also admit that my thinking about this has changed over the years. I used to take one side of this issue, now I lean towards the other. But you can decide for yourself.
WANT TO LEARN MORE?
Alan Friedman dba Zenco offers machinery vibration analysis courses and certification in accordance with ISO 18436-2. Click here to check out his course schedule, you can also connect with him on Linkedin. In addition to public classroom training and public virtual courses, Alan is also available for private courses virtually or on-site in addition to informal training and mentoring. Category I and II vibration are also available in Spanish.
Alan, aka the Vibe Guru, has over 30 years of vibration analysis experience, He has trained thousands of students around the world up to Category IV. One of the things that makes Alan a great teacher is his ability to teach people where they are at. Whether you are a math-challenged millwright, an engineer, or a PhD, Alan will challenge you without overwhelming you. If you are interested in condition monitoring you can also check out his book: Audit It. Improve It! Getting the Most from your Vibration Monitoring Program or hire him for an on-site program audit.
by Diana Pereda
Recently, while visiting a customer’s facility to provide onsite training for the vibration analysis tool they had purchased, we spent time building the database hierarchy (areas, machines and trending templates) before we started collecting data. The first room we entered had two large belt-driven overhung fans and even without collecting any data it was obvious that one of the fans was running extremely rough. After collecting data off both of the fans we stopped to review the data. As some of you with experience might already have guessed, the fan that was vibrating excessively had an extremely high turning speed (1×) amplitude.
Immediately the comment was made by the technician that his diagnosis was that the fan needed to be balanced, and if you simply looked at the vibration data that was the correct diagnosis; however, if you looked around the room and at the fans themselves, they were screaming clues about the root cause of the unbalance.
This facility was involved in the manufacture and processing of wood products which results in large amounts of wood dust being produced. These fans were designed to ventilate a high dust area and everything inside the room was covered in wood dust. It only makes sense that if everything inside the room was covered in wood dust, how much had also accumulated on the inside of the fan?

Before we walked back to the maintenance shop and informed the maintenance manager that we had a fan that needed balancing, I asked the technician if the fan could be stopped for a short period so that the inspection door could be opened. Once the fan was stopped and properly locked out, we opened the inspection door and found the fan blades heaped with accumulated stuck-on wood particles. After we had cleaned the fan blades, we had pile of wood chips which probably weighed somewhere around 5 lbs. We closed the inspection door and removed the lockout and asked operations to start the fan. Once the fan had been operating for a few minutes, we recollected data and the 1× fan amplitude had dropped significantly to a level that the fan no longer required balancing.
While it’s true that sometimes fans require balancing, often the cause is much simpler. Foreign material can build up on the fan blades and then suddenly a large piece comes off one of the blades causing the imbalance. This situation is more common than you might think, so before conducting any balance job perform a close inspection.
Watch our Balancing Know-How: Diagnosing Unbalance video for a quick introduction to diagnosing machinery unbalance with vibration analysis!
by Diana Pereda

There is a very simple, but crucial step in the machine installation process that oftentimes gets missed. When this step is missed, it leads to a world of problems, from excessive vibration to premature failure of bearings, seals, and especially couplings.
Let me establish the problem first, then I will explain how it negatively impacts the machine.
The problem
If some types of couplings are tightened before alignment, they ultimately end up in a bind. This bound condition can also be referred to as a “preloaded” condition. When this happens, an undesirable axial and radial load is introduced into the machines even though the shafts are aligned within tolerances.
Be aware of this potential problem and remember that some couplings should not be tightened until the shaft alignment is completed.
What types of couplings are susceptible to this issue?
This issue only affects coupling that have elements that bolt the two hubs together. These couplings typically have pieces that bolt to the outer or radial face of each hub. Although there are certainly others, the main types of couplings that are extremely susceptible to this are Omegas, Raptors (New Omega), and Rubber Tire couplings.
Some couplings are less or not affected by this problem, depending on how bad the initial misalignment is when the couplings are tightened. These might include gear couplings, grid couplings, and insert-type couplings. Shim pack type couplings are flexible couplings that are particularly rigid and can be affected by preload. Leave the final torque for the end!
Summary
Omega, Raptor, Rubber Tire, and other types of couplings that bolt up, easily bind up if you move the machine after they are tightened.
Gears, grids and inserts move more freely when they are aligned. One main reason for this is that these couplings have the ability for the connecting component to freely move axially.
What does coupling preload look like?
Let’s say you are a technician that is called out to troubleshoot a major vibration issue on a brand-new fan that you did not install. Let’s also assume that the millwright that did the install, tightened an Omega coupling and then aligned the motor to the fan.
If vibration data is collected it is likely to indicate misalignment with elevated 1×, 2×, and sometimes 3× in the spectrum. When the time waveform is analyzed, it will likely indicate binding that looks like misalignment.
Sometimes this preload condition can produce only an elevated 1× which would seem to indicate unbalance. The problem with preloaded coupling issues is that a laser alignment may look completely fine, and a balance will be unsuccessful and unnecessary. The only solution is to remove the preload condition of the coupling.
How to remove coupling Preload
Here’s the easy part. This problem is extremely easy to correct and even easier to avoid. To correct, simply loosen the coupling and retighten. This should relieve the preloaded condition. It is always a good idea to collect vibration data before and after, to document the improvement.
To avoid the issue, when dealing with preload-prone couplings, bolt the pieces of the coupling together but leave them loose. We need the hubs to rotate together in most cases for laser alignment. Align the shafts to tolerances, then tighten the coupling. When this happens in the proper sequence, everything is happy.
Conclusion
Be aware of the potential for coupling preload to affect vibration readings and machine health and strive to avoid this conditions from occurring in the first place, using the guidelines described above.
Download our Misalignment & Vibration infographic a reference guide to misalignment condition.
by Diana Pereda
There are different ways to understand machinery vibration analysis that people often confuse. Is vibration the cause of the problem, the result of the problem, or both? If you confuse these, you might make some big mistakes when analyzing data! So, let’s clarify…

Vibration as the Cause
When things vibrate a lot or “too much,” it can cause a lot of problems. Excessive vibration causes fatigue failures. Shafts, couplings, bearings, seals, pipes, foundations, and any structure, can actually be damaged by excessive vibration.
Excessive vibration can also cause quality problems in our products. Imagine an HVAC fan vibrating next to a computer chip printing machine. The vibration can travel through the floor from the fan to the machine and screw up our chips. Vibration can harm humans as well and even when it doesn’t harm us, it can annoy us – just think of that unbalanced ceiling fan going “whop whop whop” while you are trying to sleep.
A metaphor I like to use is: Imagine you are driving your car really fast on a really bumpy road. If you keep driving like that, the vibration will damage your car.
When I audit people’s vibration programs and I watch how they analyze data, I often see them thinking about vibration in this way. They look at a graph, look at the highest peaks, and say to themselves “This vibration isn’t too high, the machine is OK.” Or perhaps they use ISO RMS alarm charts and compare the measured vibration to the chart. Now I will explain why this is a big mistake!
Vibration as an Effect
When we use vibration in the context of #ConditionBasedMaintenance #CBM we are frequently looking at vibration as the effect rather than the cause, going back to the car metaphor. Imagine you drive your car to work the same way every day and one day you notice a new sound. You conclude “There must be something wrong with my car!”
In this case, we are not saying that the new sound is damaging the car but rather the new noise is an EFFECT or result of the damage. It is also possible that the amplitude of that new noise might be quite low, even if the damage is serious.
In a piece of rotating equipment, consider a defect on the outer race of a rolling element bearing. The balls or rollers hit the defect as they roll over it is creating a repetitive clicking. The amplitude of the vibration caused by a ball or roller hitting this little defect on the race through a layer of grease is pretty small compared to the vibration caused by water flowing through a pump or even by the shaft rotating around – BUT – the bearing is in fact damaged – AND – if we are just looking at our vibration to see if there’s anything “High” then we might miss this important fault. This is one reason why it is NOT ok to just look at vibration in terms of absolute amplitudes.

Effect and Cause
There are some cases where the vibration is both the effect and the cause. For example, if a rotor is out of balance, the vibration amplitude will increase at the shaft rate frequency (1x). This is an indicator that the rotor is out of balance. Why do we care that the rotor is out of balance? Because the increase in vibration resulting from the unbalance can cause damage to the machine. This therefore is a case where vibration is both effect and cause.
WANT TO LEARN MORE?
Alan Friedman dba Zenco offers machinery vibration analysis courses and certification in accordance with ISO 18436-2. Click here to check out his course schedule, you can also connect with him on Linkedin. In addition to public classroom training and public virtual courses, Alan is also available for private courses virtually or on-site in addition to informal training and mentoring. Category I and II vibration are also available in Spanish.
Alan, aka the Vibe Guru, has over 30 years of vibration analysis experience, He has trained thousands of students around the world up to Category IV. One of the things that makes Alan a great teacher is his ability to teach people where they are at. Whether you are a math-challenged millwright, an engineer, or a PhD, Alan will challenge you without overwhelming you. If you are interested in condition monitoring you can also check out his book: Audit It. Improve It! Getting the Most from your Vibration Monitoring Program or hire him for an on-site program audit.
Did you know that Alan Friedman left Mobius and is now providing his own courses?
by Diana Pereda