Machines are like people. They all have certain similarities but are different in many ways. Two exact machines in the same operation may perform and respond quite differently.
Setting alarm values for your vibration measurements is critical for the success of your vibration monitoring program. Alarms will help the analyst identify when conditions on the machine have changed and assist in identifying specific fault conditions. All of this makes the analysis much more accurate and easier. Additionally, this can reduce the amount of time required to analyze the vibration data collected. However, for all this to work the alarms must be set up correctly.
Does the question become what alarm values do you use? Determination of alarm values is especially difficult for the inexperienced analyst, or when no historical data is available for the equipment. Many sources have published generic alarms based upon specific equipment types and operational speeds. These published alarms can be very valuable in certain circumstances. However, as stated previously, machines are like people and are different in their performance and responses. The best method is to collect data on the equipment for a period of time and set statistical alarms for each machine based on its unique operating characteristics, performance, and type.
This method will always provide the best results for your vibration program and increase the accuracy of your analysis.
Check out our VIBWORKS vibration analyzer.
by Trent Phillips
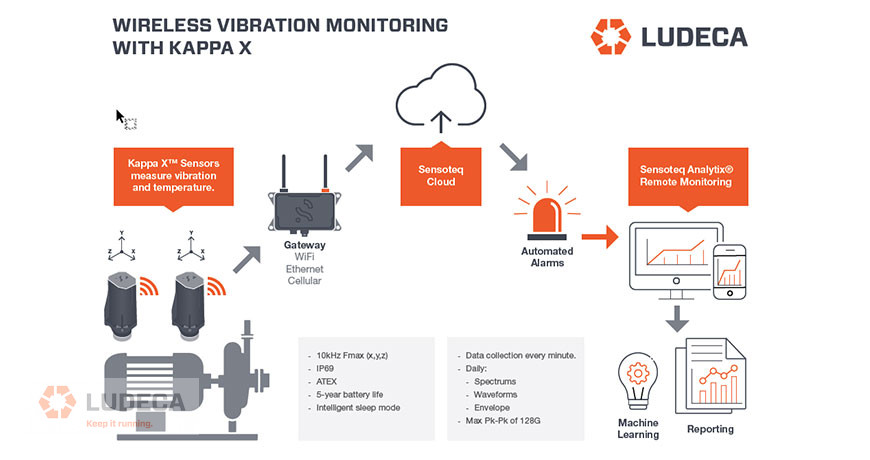
- Accuracy: Choose sensors with high accuracy levels for reliable measurements. The Kappa X ensures remote monitoring with data acquisition every minute.
- Frequency Range: Ensure the sensors cover the required frequency range. Kappa X offers up to 10kHz Fmax and 6400 Lines of Resolution (LOR) for a comprehensive vibration spectrum view.
- Battery Life: Opt for sensors with long-lasting batteries. The Kappa X has a 5-year user-replaceable battery life.
- Wireless Range: Check the range and connectivity options. The Kappa X provides a 1,000 feet line-of-sight working distance from sensor to gateway.
- Data Storage and Transfer: Evaluate storage capacity and data transfer methods. The Kappa X communicates wirelessly through various gateways, storing data locally and sending it to the cloud based Analytix software.
- Durability: Look for sensors designed to withstand harsh environments. The Kappa X is rated IP69K, providing protection against dust, high temperature, and high-pressure water.
- Compatibility: Ensure compatibility with existing systems or software. The Kappa X data can be viewed on any device, integrated with routine monitoring efforts, and exported to PLC/DSC via MODBUS.
- Cost and Scalability: Consider the cost and potential for future expansion. The Kappa X offers easy installation, no wiring required, and the ability to monitor hard-to-reach areas for comprehensive coverage.
By considering these factors, you can make an informed decision when purchasing wireless vibration sensors that align with your monitoring goals, providing accurate and reliable data for proactive maintenance and equipment optimization.
Wireless Vibration Monitoring: How to benefit from an IoT Solution at your facility
by Diana Pereda
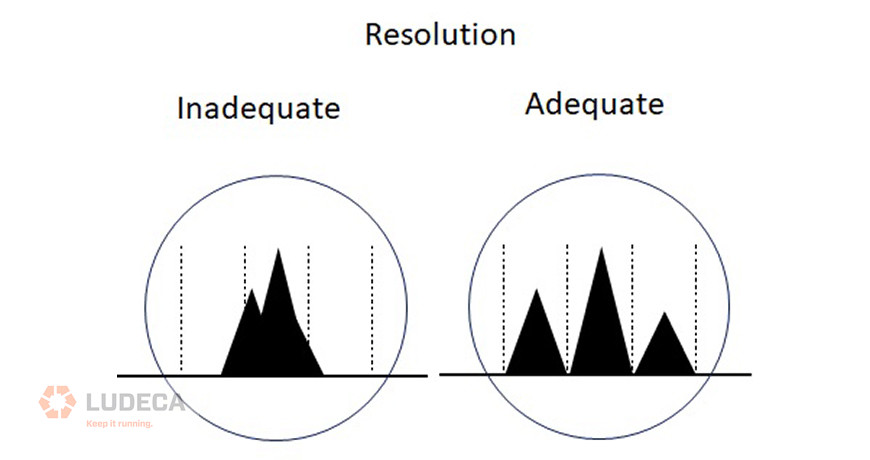
Lines of resolution (LOR) describes the number of lines of information that appear in the spectrum (FFT) acquired by the vibration data collector. LOR can be calculated by dividing the overall frequency range collected (Fmax) by the number of lines selected.
LOR represents the amount of detail in the collected data. Without sufficient detail in the collected data, multiple peaks may merge together. This may prevent the correct identification of machinery faults and lead to false conclusions. It is very important that the correct LOR and sensors (accelerometers) be selected for the specific equipment being monitored.
Learn more about our VIBWORKS vibration analyzer.
Setting the proper Lines of Resolution (LOR) is essential for effective vibration analysis
by Trent Phillips
Wireless vibration sensors like Kappa X offer several benefits compared to traditional wired sensors, including:
- Remote monitoring: Wireless vibration sensors can transmit data wirelessly to a central monitoring system, allowing maintenance personnel to monitor equipment performance and detect issues remotely.
- Real-time alerts: Wireless vibration sensors can be configured to send real-time alerts via email or SMS text when vibration levels exceed preset thresholds, allowing maintenance personnel to take immediate action to prevent equipment failure.
- Flexibility: Wireless vibration sensors can be placed in locations that are difficult or impossible to access with wired sensors, providing more comprehensive monitoring coverage.
- Easy installation: Wireless vibration sensors are easy to install and do not require any cabling or wiring, which can reduce installation time and costs.
- Improved safety: Wireless vibration sensors can be used in hazardous or hard-to-reach locations, reducing the need for maintenance personnel to access these areas and improving overall safety.
Overall, wireless vibration sensors like Kappa X offer a range of benefits that can help businesses improve equipment performance, reduce maintenance costs, and enhance safety. By providing real-time data monitoring and alerts, wireless vibration sensors can help businesses to implement predictive maintenance strategies and prevent equipment failure, minimizing downtime and maximizing productivity.
Wireless Vibration Monitoring: How to benefit from an IoT Solution at your facility
by Diana Pereda
Importance of Setting up Alarms and Baselines in Machinery Vibration Analysis
Machinery vibration analysis is an essential tool for monitoring the health of industrial equipment. It involves measuring the vibration of machines and analyzing the data to identify potential issues. One of the critical aspects of vibration analysis is setting up alarms and baselines to detect abnormal machine behavior. Alarms and baselines act as reference points for measuring machine vibration. They help identify when the machine is operating normally and when there is a problem. Baselines are established by measuring the vibration of a machine when it is in good condition. The vibration levels recorded are used as a reference point for future measurements.
Alarms are set up to notify maintenance personnel when the vibration levels exceed a predefined threshold. The threshold levels are typically set based on industry standards, manufacturer recommendations, or the specific needs of the organization. By setting up alarms, maintenance personnel can take corrective action before the machine fails, reducing downtime and repair costs.
In addition to detecting problems, alarms and baselines are also essential for trending data. Trending data involves tracking the vibration levels of a machine over time. By comparing the current vibration levels to the established baseline, maintenance personnel can identify trends that indicate changes in machine behavior. This information can be used to predict when a machine is likely to fail, allowing for proactive maintenance.
In summary, setting up alarms and baselines is critical for effective machinery vibration analysis. They provide reference points for measuring machine vibration, help detect abnormal behavior, and are essential for trending data. By using this information, maintenance personnel can take proactive steps to prevent machine failures, reducing downtime and repair costs.
Testing Machines Under Repeatable Conditions for Machinery Vibration Analysis
Testing machines under repeatable conditions is another critical aspect of machinery vibration analysis. To obtain accurate and reliable data, machines must be tested under controlled conditions that can be repeated. This ensures that the vibration measurements are consistent and can be compared over time. When testing machines, it is essential to consider factors such as load, speed, and operating conditions. These factors can significantly impact the vibration levels of a machine. By testing machines under the same conditions, maintenance personnel can identify changes in vibration levels that may indicate a problem. Repeatable testing also helps establish baselines and set up alarms. By measuring the vibration of a machine under controlled conditions, maintenance personnel can establish a baseline for future measurements. This baseline can be used to set up alarms to detect abnormal machine behavior.
Furthermore, repeatable testing can help validate the effectiveness of maintenance activities. By measuring the vibration levels of a machine before and after maintenance activities, maintenance personnel can determine if the activities were successful in reducing vibration levels.
In conclusion, testing machines under repeatable conditions is critical for accurate and reliable machinery vibration analysis. It ensures that vibration measurements are consistent and can be compared over time. This information can be used to establish baselines, set up alarms, and validate the effectiveness of maintenance activities. By using this information, maintenance personnel can take proactive steps to prevent machine failures, reducing downtime and repair costs.
WANT TO LEARN MORE?
Alan Friedman dba Zenco offers machinery vibration analysis courses and certification in accordance with ISO 18436-2. You can see the live course schedule here: www.ZencoVibrations.com/events. You can connect with him on Linkedin. In addition to public classroom training and public virtual courses, Alan is also available for private courses virtually or on-site in addition to informal training and mentoring. Category I and II vibration are also available in Spanish.
Alan, aka the Vibe Guru, has over 30 years of vibration analysis experience, He has trained thousands of students around the world up to Category IV. One of the things that makes Alan a great teacher is his ability to teach people where they are at. Whether you are a math-challenged millwright, an engineer, or a PhD, Alan will challenge you without overwhelming you. If you are interested in condition monitoring you can also check out his book: Audit It. Improve It! Getting the Most from your Vibration Monitoring Program or hire him for an on-site program audit.
Did you know that Alan Friedman left Mobius and is now providing his own courses?
by Diana Pereda

Misalignment: High amplitude peaks will appear at 1×, 2×, and sometimes 3× the running speed. Look for a 180° (± 30°) phase change across the coupling in the axial direction (for angular misalignment) or radial direction (for parallel (offset) misalignment). Bearing misalignment (cocked bearing) will cause a twisting motion in the axial direction. Look for a 180° (± 30°) phase change from the top to the bottom of the bearing housing or from one side to the other.
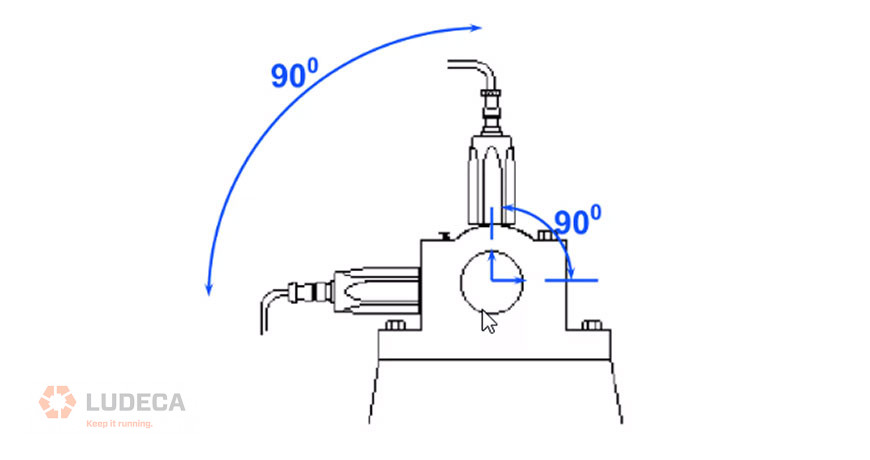
Imbalance: A high amplitude peak will appear at 1× the running speed. Confirm that the phase difference from horizontal to vertical on the bearing is close to 90° (± 40°). The phase difference between left and right horizontal locations should be within 30° of the phase difference between left and right vertical locations. If the phase is unstable, there may be another reason for a large running speed vibration, e.g. looseness or misalignment.
You can investigate the degree of couple imbalance versus force imbalance by looking at the phase difference between the two sides of the machine—if there is little couple imbalance then only a single plane correction may be required to balance the rotor.
Resonance (flexible structures): High amplitude peaks will appear where natural resonance frequencies of the structure coincide with excitation frequencies (e.g. 1×, or other low orders of running speed, blade pass frequency, etc.) Look for a 0° phase change when both sensors are positioned in the same direction between two stationary points. The phase change will be 180° when there is a stationary point between the sensors.
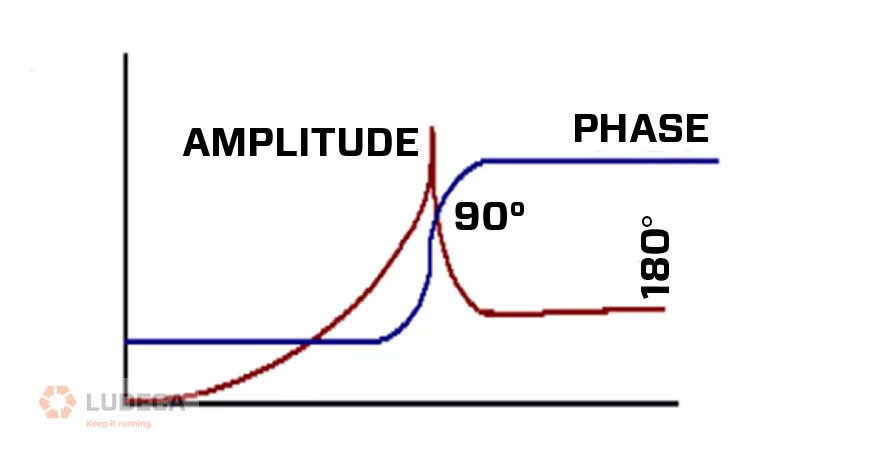
Resonance (variable speed machines): To investigate resonance you can vary the machine speed. A phase shift of 180° will occur as machine speed is increased from below a resonance to above a resonance. A 90° phase shift will be present at the resonant frequency. If a machine is running close to resonance, any small speed variation will cause large phase shifts.
Resonance (at a bearing): Look for a change from the normal 90° phase difference in the horizontal and vertical directions at 1×. When a natural frequency is close to 1× in either direction, that phase angle may well be on the way towards its 90° phase change so the two phases may no longer be 90° apart (assuming that the structure has a different natural frequency in either direction).

Eccentric belt pulley: A high amplitude peak will appear at 1× the running speed of the pulley. Look for a phase change of either 0° or 180° between the horizontal and vertical readings, which indicates straight line motion instead of the usual 90° difference. This symptom is similar to bearing resonance (described above), however, in this case, the direction of maximum vibration will be in line with the two belts.
Mechanical looseness: High amplitude peaks will show up at many multiples of the running speed, and sometimes even multiples of 0.5× running speed, e.g. 1.5×, 2.5×, etc. Look for fluctuating phase readings at a location from one recording to the next, to the next. Also, compare the phase readings at 30° increments around a bearing housing—the phase will be significantly different at each angle.

Mechanical foot looseness (soft foot): A high amplitude peak will show up at 1× the running speed. Look for a 90° to 180° phase change between the machine foot and its concrete base. The soft foot may also have a different phase measurement from the other feet.
Learn more about our VIBWORKS vibration analyzer.
Phase Measurement: What is it for? And how you can use it to diagnose failures in 2020.
by Diana Pereda
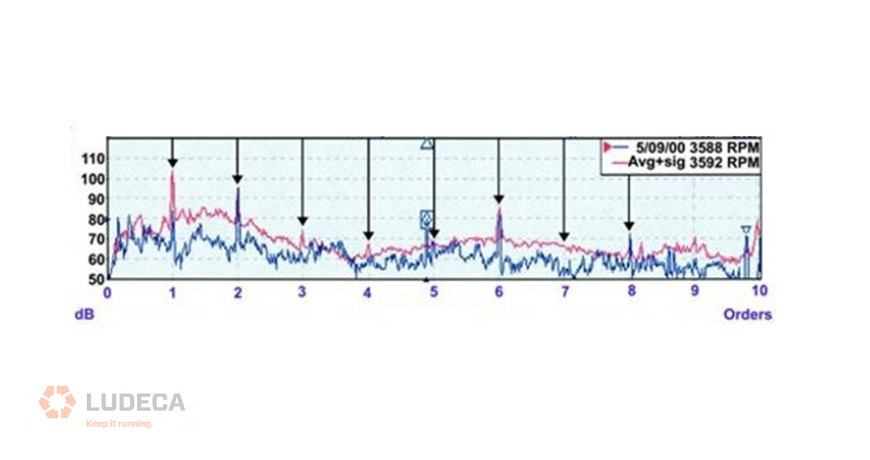
Frequency can be defined as how often an event occurs per unit of time. A vibration spectrum is displayed as a horizontal and vertical plot (X and Y). The horizontal (X) axis is the frequency axis and shows a representation of how often an event occurs. Typically, the vibration analyst may use multiple units of reference for the frequency axis when doing vibration analysis. The most common units used for the spectrum (FFT) are cycles per minute (CPM) and Hertz. The least known unit for the spectrum frequency axis is “Orders” or multiples of shaft turning speed. It is critical to understand the differences in the frequency units (Hz, CPM, and Orders). It can be advantageous to view data in different units depending upon the machine and the problem being analyzed.
Orders are ratios of frequencies to multiples of a shaft turning speed. For example, a 60 Hz motor turning 1780 RPM would also have a rotational speed of 29.66 Hz. The rotational speed would be referenced as one (1) order. Two (2) orders would be twice the shaft turning speed (59.33 Hz) and so on.
Certain equipment defects occur based on multiple of turning speeds. Looking at data based upon order references can make it easier to remember the specific defect frequencies and identify them during routine analysis.
An order-based analysis is a good way to set up and ensure that the correct frequency range is being monitored for variable speed machines, etc. You can define your analysis setups in order and be ensured that the correct frequency ranges will be measured by your vibration data collector as the speed of the machine changes over time.
Most modern vibration analysis software and vibration data collectors support order-based data collection and analysis. If you are unsure, then you should consult the provider of your vibration software and hardware and find out.
Watch our video Vibration Analysis Know-How: Understanding Resonance for a quick introduction to resonance and natural frequencies.
Case Study: Eliminating High Vibration Due to Natural Frequency
by Ana Maria Delgado, CRL
Wireless vibration sensors have their place in a good reliability program and can benefit the maintenance team’s ability to monitor machine health reliably. When choosing a wireless vibration sensor, the battery life is a key parameter in its selection. Designers and manufacturers should perform battery capacity models to be confident in the performance and battery life alongside actual current consumption measurements.
When creating a battery capacity model to determine battery life within a wireless sensor, there are several main considerations:
- Battery chemistry: The type of battery chemistry used in the device can greatly impact the battery life. For example, lithium-ion batteries have a higher energy density than nickel-cadmium batteries and therefore can last longer. However, Lithium Thionyl Chloride (LTC) has a stable voltage over time and high current pulse capability for wireless transmissions. It also performs better over temperature than Lithium-ion.
- Battery capacity: The capacity of the battery is an important factor in determining battery life. A larger capacity battery will last longer than a smaller capacity battery under the same usage conditions. However, the larger the capacity, the larger the physical dimensions, so there needs to be a balance between the overall size of the sensor (& mass) and its application constraints.
- Operating conditions: The operating conditions of the device, such as temperature, humidity, and usage patterns, can greatly impact the battery life. The temperature being the biggest impact, since the sensor may have a wider operating range of -40⁰C to 80⁰C.
- Battery age: As batteries age, their capacity decreases, so the model should add this parameter as a %.
- Energy consumption: This can be the difficult part, as it needs to consider all the different operating modes of the sensor, such as sleep, measurement, and wireless transmissions. Each mode will consume different amounts of energy and for different durations. These duty cycles can be worked out over a fixed period of time and input into the model.
- Self-discharge rate: Batteries have a self-discharge rate over time, which means they lose capacity even when not in use, the model should take that into account in order to accurately predict the battery life. Battery chemistry has an impact on this too.
- Quality: The quality of the battery is important, manufacturers often have different quality standards, so it’s important to consider the quality of the battery being used in the model to make accurate predictions. As a product used in the reliability world, we need to rely on the sensor, easy to maintain, and of a high standard.
When performing actual measurements, multiple samples should be used and preferably samples from different manufacturing batches. This ensures that any production tolerances are understood. Testing over temperature and with different % depletion of batteries can give a good spread or standard deviation of the current consumption over life. Taking both the model and measurement inputs will give a solid indication of the battery life of your wireless sensor. In your condition monitoring or reliability program if you are planning on using wireless vibration sensors, please consider the above points in determining their battery life.
Thank you Alan McCall with Sensoteq for sharing this educational article with us!
by Diana Pereda
Vibration Route Frequency
How often do you collect vibration data on your equipment? Is it monthly, quarterly, or even yearly? Most of the time management will allow data collection frequencies based upon the importance they assign to vibration analysis or available resources at the time. Management may ask that vibration data be collected every month or even more frequently if the machine has failed recently. Different companies and managers use different means to determine how often to collect vibration data or any other CM data for that matter.
Assigning arbitrary data collection frequencies (routes) to your equipment may do your reliability efforts a disservice. The best method is to determine the failure intervals of the failure modes (bearing defects, etc.) in the equipment. Assign data collection intervals short enough to identify these failures. For example, a bearing may develop a failure on day one and run for ninety days before it causes the machine to fail. If the machine is monitored with vibration analysis every ninety days, then your analyst may never identify the bearing failure condition in the machine. The result is that your machine will most likely fail without anyone being aware of the issue. If the same machine is monitored monthly with vibration analysis, then the bearing failure condition would most likely be identified with your vibration monitoring program. This would alert the maintenance department of the issue and allow appropriate repair efforts to be budgeted and scheduled.
Watch our Reliability Matters: What Can I Do? video to learn the benefits of vibration monitoring to keep your equipment running efficiently.
by Trent Phillips
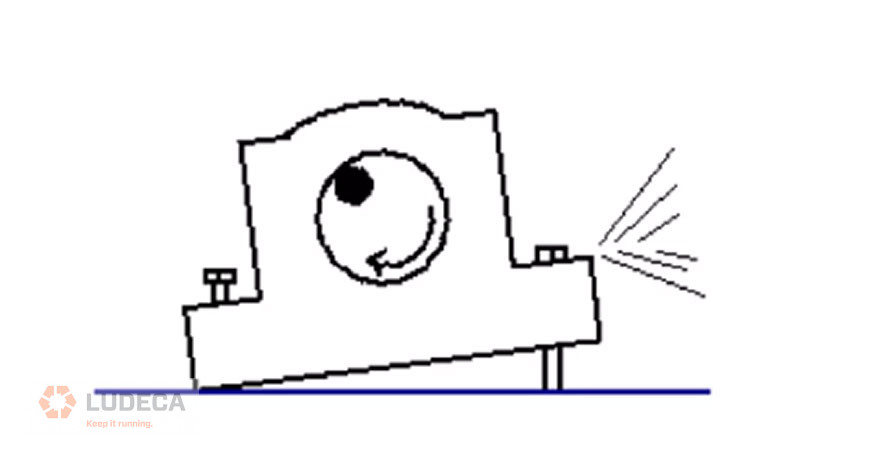
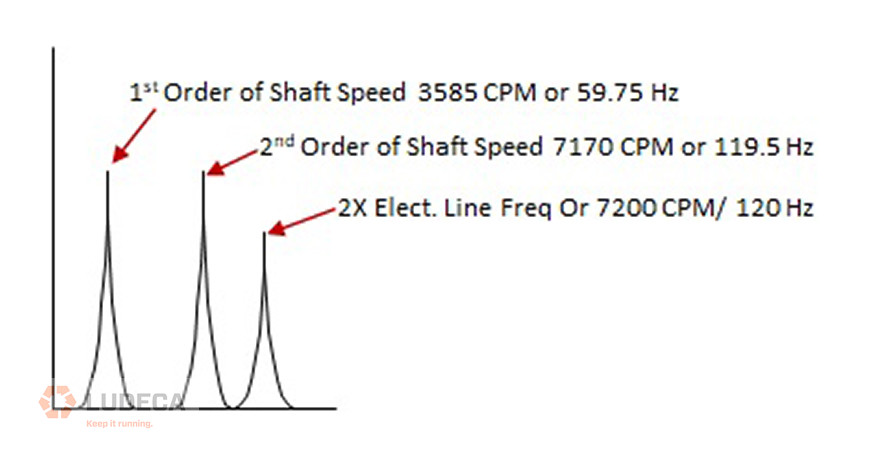
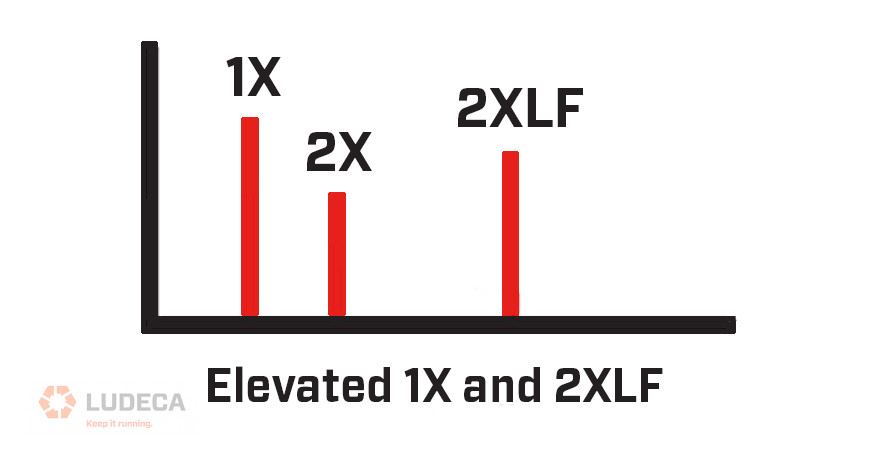
All electric motors can develop electrical and mechanical problems over time in operation. One common failure mode is caused by the motor’s stator being eccentric. Stator eccentricity problems will produce an elevated peak at the two times the electrical line frequency (2×LF) which in the United States is 120 Hz (7200 CPM.)
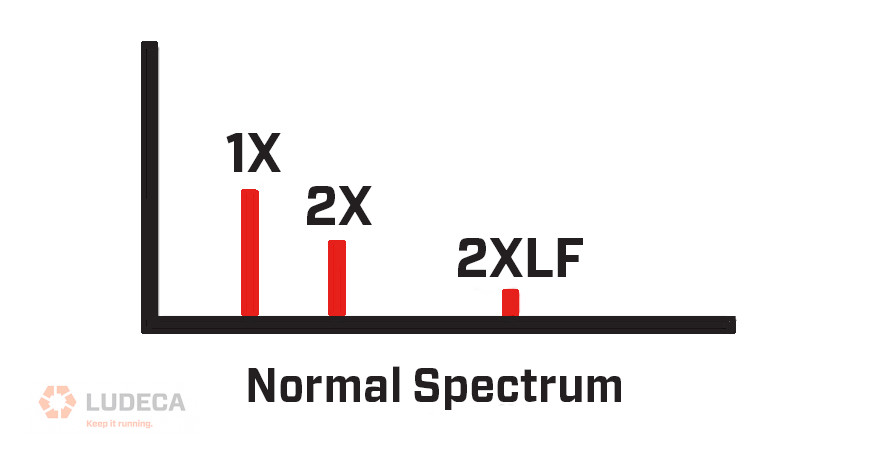
The root of the problem is excessive stator eccentricity which results in an uneven air gap between the rotor and the stator.
For induction motors, this eccentricity shouldn’t exceed 5% and for synchronous motors, it should not exceed 10%. All electric motors will produce some vibration at the 2×LF, however, it is recommended that the cause of an elevated 2×LF peak be investigated for amplitudes exceeding 0.1 in/s peak for motors that are already in service.
There is another cause which is mechanical in nature which also produces increased amplitudes at the 2×LF and is commonly known as “Soft foot”. The existence of a soft foot condition in a motor will cause the frame to become distorted when the foot bolts are tightened and will ultimately lead to premature bearing failure.
A machine is determined to have a soft foot condition if the machine frame deflects by more than 0.002″ – 0.003″ when any machine foot is tightened or loosened while the other machine feet remain tight. This deflection produces an internal misalignment of the bearing bores, leading to shaft deflection, and will greatly increase the radial loading on the bearings, which in turn will lead to premature wear and failure.
Fortunately, the procedure for checking for soft foot is easy to perform using modern laser alignment systems and feeler gauges. Another method for checking soft foot on a motor that has been placed back in service and cannot be shut down is called a running soft foot check.
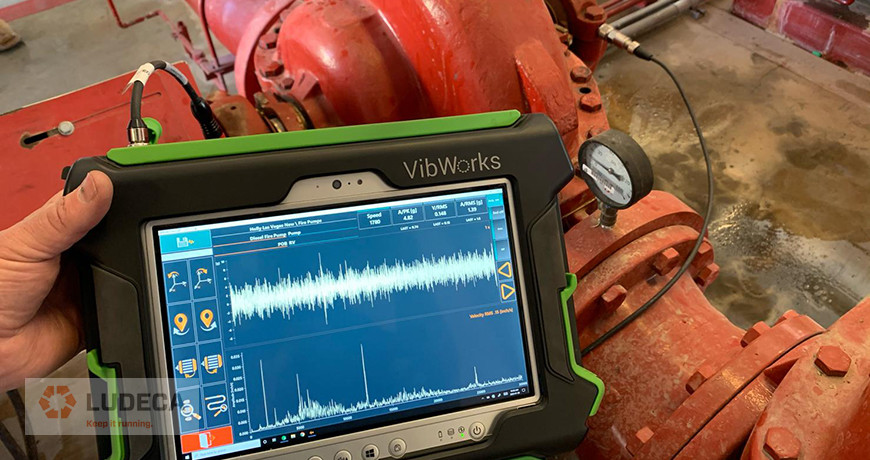
The first step to performing this check is to utilize a vibration analyzer that can stream data live. This is a feature certain vibration analyzers have which allows the user to continuously monitor the vibration spectrum while the machine is running.
CAUTION – This procedure requires “Extreme Caution”* since loosening a foot will most likely affect the shaft alignment. It is critical that only the foot being checked be loosened while all remaining machine feet remain tight. *See important note below
While the vibration analyst monitors the live vibration spectrum, one foot at a time is loosened (always with the other feet tight!) and then retightened. The best way to accomplish this check is to have a coworker loosen and then retighten each machine foot as the vibration analyst monitors the vibration spectrum. This process is then repeated until each of the machine feet has been checked.
The user will usually see a significant drop in the 2×LF amplitude and will also notice a change in the sound of the motor once the problem foot (or feet) have been loosened.
*Important Note: We mention this procedure for informational purposes since the practice is not uncommon throughout the industry. However, LUDECA does not advocate for this procedure given the safety risks involved.
Q&A Webinar: Detecting Misalignment using Vibration Analysis
by Diana Pereda
In this article, I will explain linear and non-linear vibrations in an easy-to-understand, non-mathematical way and then I will relate these concepts to machinery vibration monitoring.
Linear Systems
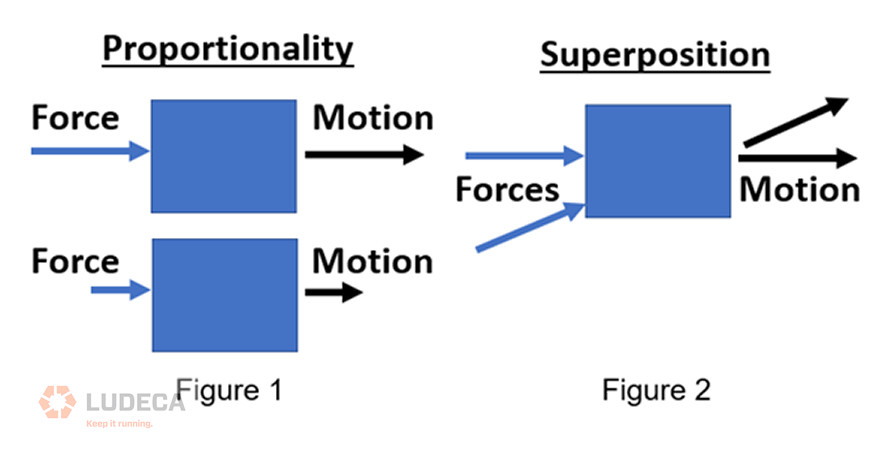
The definition of a linear system is that the output is directly proportional to the input. If you hit a billiard ball in one direction, it will move in that direction. If you hit it harder, it will move farther. This is a property called “proportionality”. (Figure 1)
If you hit the ball in two directions simultaneously, it will move in a combination of those two. This property is called “superposition.” (Figure 2)
Non-Linear Systems
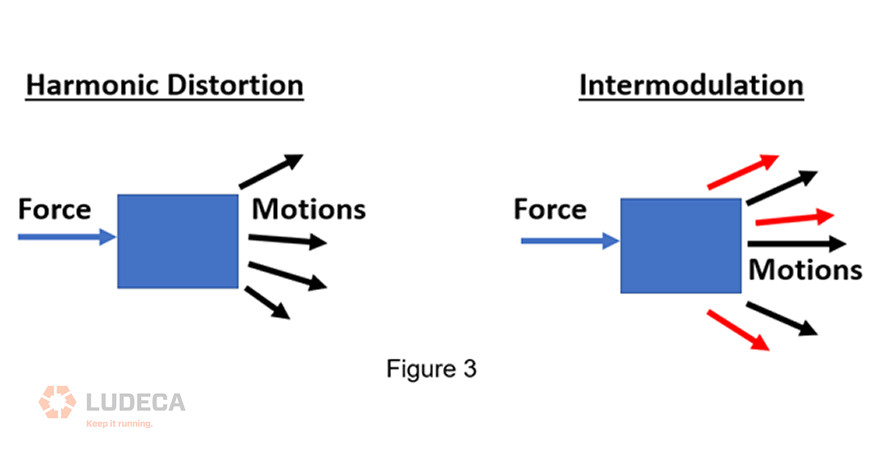
A non-linear system will contain things in the output that were not contained in the input. Rather than hitting a billiard ball, imagine hitting a cube of gelatin. You hit in one direction, but it wiggles in various directions. It moves in a number of ways that were not included in the input and are not proportional to the input. These nonlinear responses include the principles of harmonic distortion and intermodulation. (Figure 3)
Linear Machine Vibration
In a rotating machine, we can take the force generated by an unbalance mass on the rotor as the forcing frequency being input into the system. The unbalance mass rotates around with the shaft and generates a force (F) equal to the mass (m) times the radius (r) of the mass from the center of rotation times the running speed (w) squared.
F = mrw2
We can define this input force as a sine wave. If we did the FFT of this sine wave, we would get a single peak in the vibration spectrum at the shaft rotational rate. Anyone who has monitored machinery vibration will know however that in real life, not only do we see a peak at the shaft rotation rate, we also see harmonics (or multiples) of this frequency in the vibration spectrum.
Harmonics Are Examples of Non-Linearities
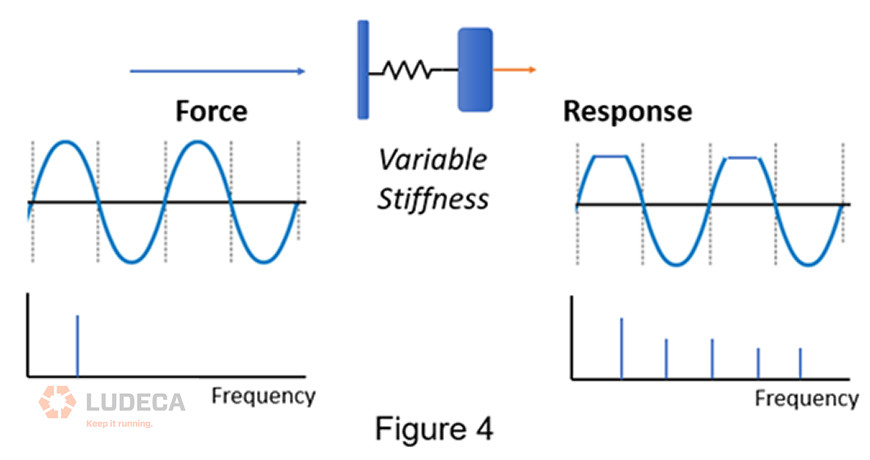
Why do we see harmonics of running speed? Because the machine is not a perfectly linear system. Here is a simple way to understand what is happening. Imagine the unbalance force is being input into a spring mass system with a stiffness (k). If the spring mass system is “linear” we can define it with the equation F=kx, where F is the input force and x is the displacement of the mass (or its vibration in units of displacement). This is a linear equation in that if “F” goes up, “x” goes up proportionally and if F goes down, x also goes down proportionally.
Now imagine that as you compress the spring, it gets stiffer. In other words, k changes or varies with displacement x. You could also imagine that the spring gets less stiff the more you stretch it. I won’t write this down as a mathematical equation, but the fact that k varies with x makes this a non-linear equation. F and X will no longer always be directly or linearly proportional because k is also varying. If the input is a sine wave, the output is going to be a distorted sine wave – either flatter where the system increases in stiffness or taller where stiffness decreases. When we do the FFT of this distorted wave, we get harmonics in the spectrum. This is a non-linear response because these new harmonic frequencies were not in the input but they are in the output! (Figure 4)
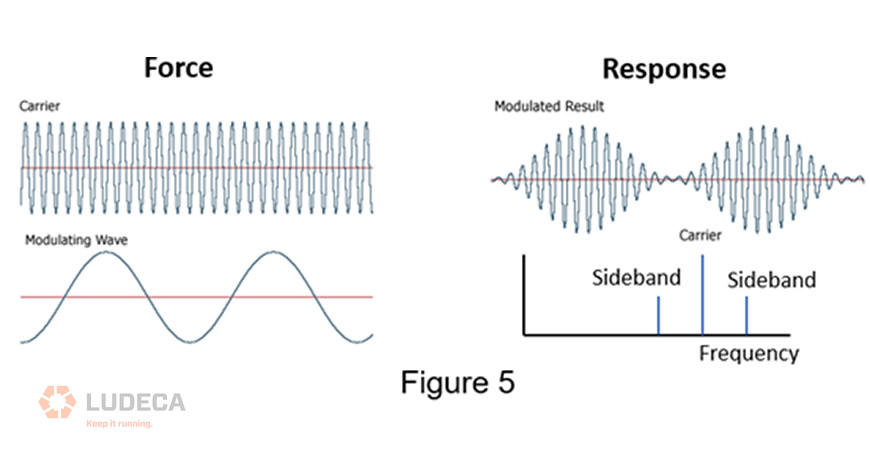
Sidebands Are Also the Result of Non-linearities
Amplitude (or frequency) modulation in the time waveform results in sidebands in the spectrum. Amplitude modulation is the repetitive change (modulation) in the amplitude of a signal (the carrier). Although the input only contains a single frequency (the carrier) that is varying in amplitude at a certain rate, the output contains the carrier frequency plus and minus the modulating frequency. These peaks on either side are called sidebands. This is a nonlinear response because there is nothing in the input that is actually happening at the sideband frequencies. These are new. (Figure 5)
Amplitude modulation and sidebands are common in rolling element bearing defects, electric motors, and gears. We can say in a general way that as a defect worsens over time we will expect to see more (quantity) and higher amplitude harmonics and sidebands.
How Does This Relate to Machine Health?
In a general sense, we can say that healthy machines behave in a more linear fashion than unhealthy machines. Defects such as cracks, loose bolts, rotating looseness, and rubs will result in non-linear behavior and we will see more and larger harmonics in the vibration spectrum. In the case of journal-bearing rubs or looseness; we may even see a pattern of subharmonics. These are sub multiples of running speed (1/2 x, 1/3 x, or even 1/4 x harmonics.) You can think of a rub as an increase in stiffness and looseness as a lessening of stiffness.
In a general, qualitative way, we can say that a healthy machine will have a “cleaner” spectrum and as the machine wears out or becomes defective, we will see more and larger harmonics, sidebands, and noise.
Want to Learn More?
Alan Friedman dba Zenco offers machinery vibration analysis courses and certification in accordance with ISO 18436-2. You can see the live course schedule here: www.ZencoVibrations.com/events You can connect with him on Linkedin. In addition to public classroom training and public virtual courses, Alan is also available for private courses virtually or on-site in addition to informal training and mentoring. Category I and II vibration are also available in Spanish.
Alan, aka the Vibe Guru, has over 30 years of vibration analysis experience, He has trained thousands of students around the world up to Category IV. One of the things that makes Alan a great teacher is his ability to teach people where they are at. Whether you are a math-challenged millwright, an engineer, or a PhD, Alan will challenge you without overwhelming you. If you are interested in condition monitoring you can also check out his book: Audit It. Improve It! Getting the Most from your Vibration Monitoring Program or hire him for an on-site program audit.
Did you know that Alan Friedman left Mobius and is now providing his own courses?
by Ana Maria Delgado, CRL
Machinery Lubrication • September 2022
Imagine buying a new car and not taking it for a test drive first. That might not be so bad, given the built-in protections covering the auto buyer these days. But what about buying industrial equipment? Purchasing a new machine and finding unexpected problems after installation and integration into your manufacturing process is the stuff maintenance and production nightmares are made of.
Of course, you will have a warranty, just like when buying a car. You might even be entitled to a loaner. But none of this is of any real use to you if your problems and production disruptions continue.
In most industries, the process of manufacturing is just slightly less expensive than the price received for the product manufactured; the margin is tight. This being the case, unplanned costs are unwelcome additions to the manufacturing process. Most modern industries have recognized the value of process engineering and are making sure that capital expenditures for industrial machines are spent on the right machines.
To meet that challenge, acceptance testing can be employed, and if properly designed and implemented, the likelihood of unplanned costs incurred after commissioning can be virtually eliminated. Most facilities don’t “design” their acceptance testing, but rather simply apply a standard overall measurement considered to represent a typical machine in “generally” good condition. This is much better than no acceptance testing and means you probably get “generally” good results.
But if you prefer to ensure good results, then you might want to actually design your acceptance testing to do so. Here’s how:
1) One key component of acceptance testing will include gathering vibration data. Understand that an overall vibration signal is a conglomerate of numerous components. Among those components are:
- RF (rotational frequency) or 1× rotational speed, which is the primary indicator of the amount of unbalance present.
- 2× RF, often an indicator of misalignment.
- 3× RF, also often an indicator of misalignment and/or mechanical looseness, or a coupling defect for certain types of couplings.
- Electro-mechanically generated vibration (inherent in electric motors and acceptable at certain levels.)
- ½ RF (and/or other sub-synchronous vibration.)
- Vane or blade passing frequency vibration (inherent in certain equipment and acceptable at certain levels.)
Note that no mention is made of bearing defect-generated vibration. We assume acceptance testing will mostly take place on new or refurbished assets, hence, if there is a bearing defect it will contribute to the overall vibration measurement, but its contribution will be relatively small until the bearing is well on its way to failure. In fact, most early to mid-stage bearing defects will not, by themselves, cause machines to fail the generally used acceptance standards.
Consider that a vibration signal where the RF constitutes ¾ or more of the overall signal would be considered acceptable/ This is the expected healthy percentage. The reason is, in a typically healthy machine, the residual unbalance is the dominant vibration. Unbalance to some level is always expected, and when the residual unbalance is reduced to a level that won’t adversely affect the equipment service lifetime, this is acceptable. Therefore, if the unbalance is limited to a healthy level and that level represents 80-90% or more of the overall vibration, then that machine is highly likely to be a healthy machine.
Now consider that many of the standard overall measurements used for acceptance testing have no way of determining what percentage of the measurement constitutes any certain vibration component.
Therefore, augmenting the standard broadband overalls (also called “unfiltered measurements”) with well-designed narrow band limits (Technical Associates of Charlotte’s ‘Proven Method’ being an example of this) might be a good idea. Adding an RMS acceleration band or two for anti-friction bearing machines is another possibility.
One client we have tested for has enhanced their acceptance criteria by adding a few additional specific frequency component requirements to the standard acceptance overalls. Their added specifications run something like this:
- No individual peaks in the spectra shall exceed 40% of the RF peak when the RF peak is above 0.08 inches/sec.
- No bearing defect frequencies shall be observable in the vibration spectra.
Next, approach acceptance testing like you should approach condition monitoring in any other situation. Test for the applicable failure modes. Is it farfetched to expect a new machine to be free of incipient defects? If your answer is “no”, design your acceptance testing requirements to identify failure modes and exclude their detectable presence in new/rebuilt installations.
Make sure your acceptance testing includes our VIBWORKS vibration analyzer.
by Ana Maria Delgado, CRL
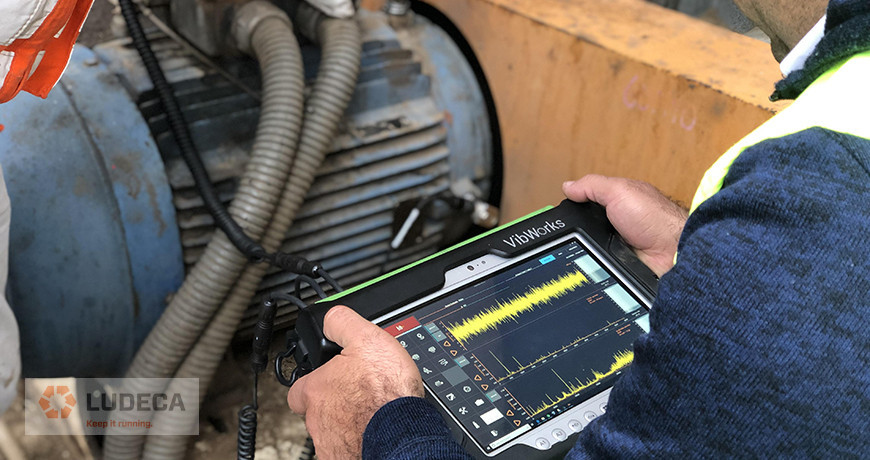
In today’s world-class facilities, maintenance and reliability departments require data collection on a consistent and periodic basis to guarantee that assets in a plant operate efficiently and reliably.
Vibration monitoring actively monitors the health of critical assets for potential failure conditions. This yields great results in identifying potential failure conditions for repair before unwanted downtime or other costly consequences are experienced.
Typical walk-around vibration programs can take time to establish and get going, whereas online condition monitoring can be expensive due to the installation costs including labor, cables, sensors, etc. Moreover, a cabled installation might even be impossible in certain situations due to accessibility issues.
On the other hand, an IoT solution such as wireless technology can solve all of these problems and is an ideal solution for most facilities. Having a wireless vibration program with smart sensing technology is cost-effective for all manufacturing applications. A wireless vibration solution such as the Sensoteq Kappa X with prolonged battery life, a Fmax of 10kHz, and 6400 lines of resolution with signal analysis with enveloping can provide unparallel level of diagnostic capabilities and asset health monitoring of your plant machinery.
Data can be viewed from anywhere in the world and you can be notified of any issue arising in your assets via either a PC or mobile device, and the data can also be seamlessly entered into your facility’s PLC or DCS system.
by Ana Maria Delgado, CRL
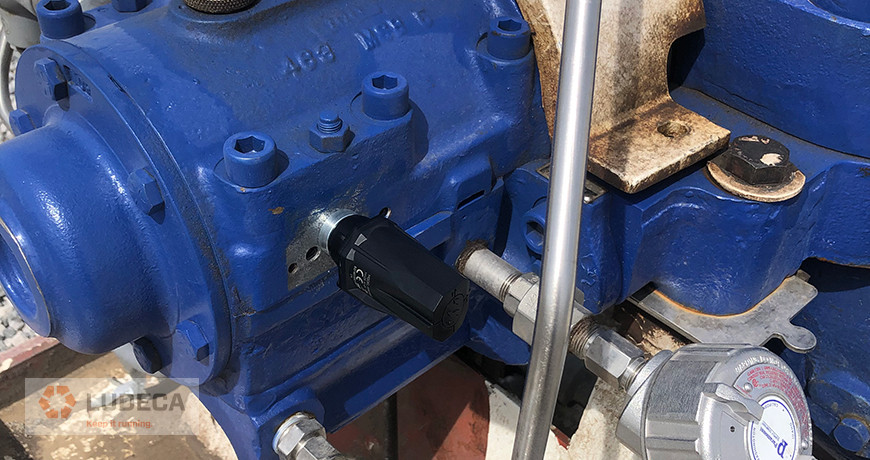
Reliability groups are often expected to collect data on critical assets in a consistent manner to ensure the asset’s health is monitored efficiently, and to maximize the life of that equipment. Doing this task manually may pose a safety or health risk to the personnel responsible for collecting the data. One of the solutions is to install permanently mounted sensors and wire them to a termination/switch box in a safe location.
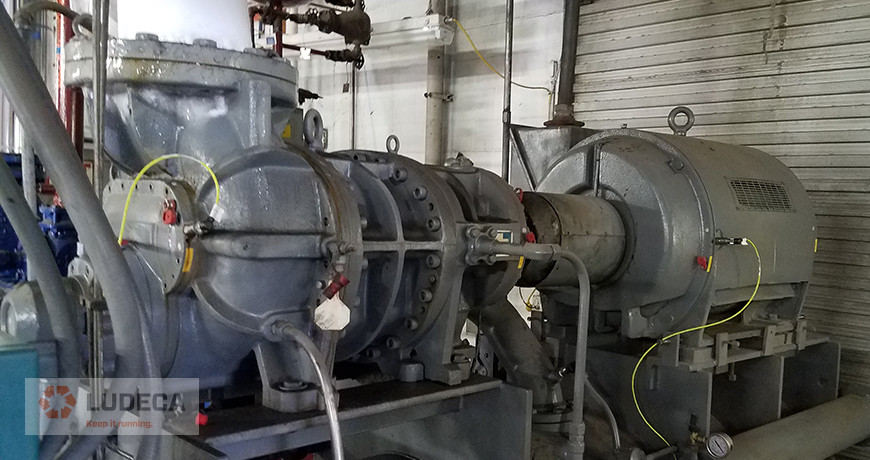
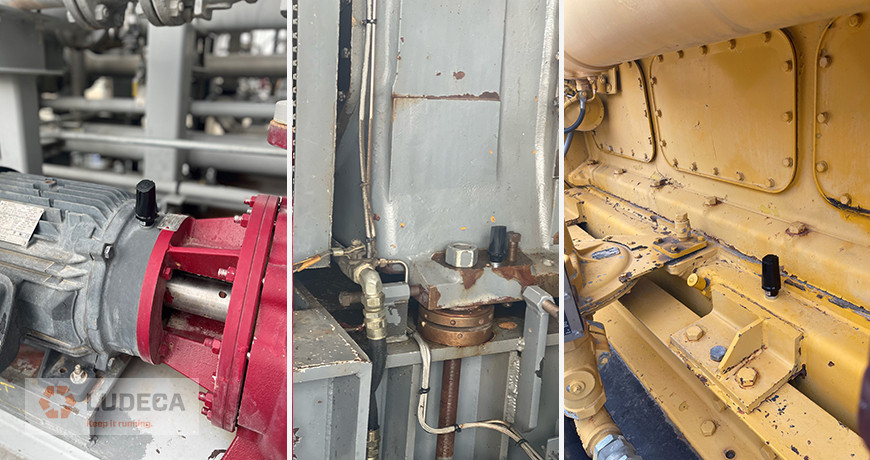
It is important to note that there are several ways to permanently mount sensors to an asset, but the most common are:
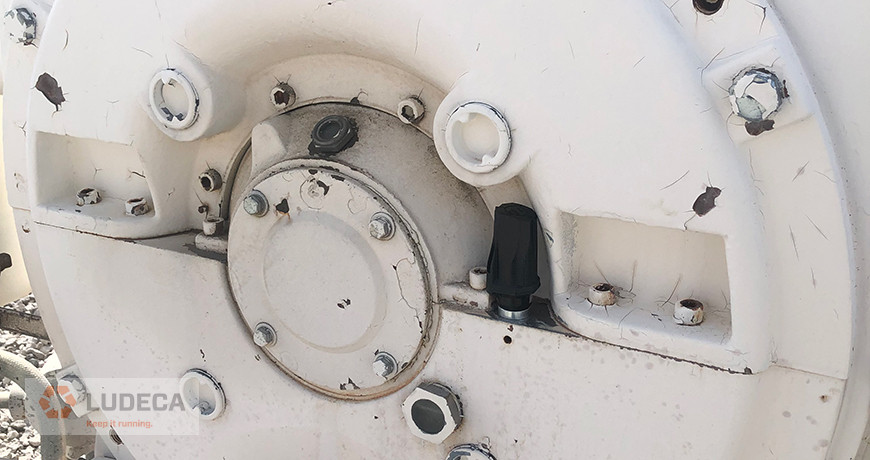
Adhesive Mount
As the name says, this process entails utilizing a strong epoxy-like adhesive that creates a sturdy bond between the sensor and the asset. It is imperative that the two surfaces be thoroughly stripped of any paint and/or corrosion using a steel wire brush. This should be done to remove any surface imperfections that can compromise the integrity of the bond between the sensor and the asset, as well as remove signal dampening layers between the sensor and the machine.
Drilling and Tapping Mount
This process entails physically drilling a small pilot hole into the casing of the asset and then tapping the hole to match the thread of the stud included with the chosen sensor. This method is one of the preferred methods in the industry as it ensures a perfectly solid mount between the sensor and the asset.
Switch Box Vibration Data Collection
For either of the above methods, cabling must be routed to provide communication. It is of the utmost importance to route the cable through suitable conduits so that it is protected from harsh temperatures or chemical exposure that can potentially cause damage. Utilizing a label machine to identify each cable will ensure that the final wiring in the termination/switch box is accomplished properly and easily. Once the physical installation of the permanently mounted sensors and wiring is completed, the reliability technician that oversees the Condition Monitoring program can safely and efficiently collect data with the help of a capable data collector such as the BETAVIB’s VibWorks system. This will greatly improve the uptime of a facility’s assets and help maintain world-class reliability while maximizing the safety of its employees.
The importance of proper sensor installation when performing vibration analysis
by Ana Maria Delgado, CRL
In the field of vibration analysis, there is an abundance of technical terms. We provide definitions for some of these terms that you might hear from an engineer or technician as well as read in reports and might need further clarification. We welcome you to check out our glossary of terms relating to vibration analysis, and hope you find it valuable!
- Average – In vibration analysis, an average usually refers to the process whereby the vibration software will, after converting waveforms into spectrums via FFT, add the resultant spectrums together and then divide by the number of spectrums added together. The result is an “averaged spectrum”.
- Band – A band is simply a range of frequencies e.g. A band from 0 Hz, to and including 5 Hz, is a band that is 5 Hz wide.
- Band Pass Filter – A filter that blocks all data above and below its defined band.
- Condition Monitoring – The use of specialized equipment to deduce the actual condition of the equipment as pertains to its fitness for continued use. Condition monitoring is the foundation of Predictive Maintenance and the two terms are sometimes used interchangeably.
- Cycles per minute (CPM) – In vibration analysis, cycles per minute refer to the number of vibratory cycles that occur in one minute of time. Cycles per minute is a quantity of frequency.
- Cycles per second (CPS) – In vibration analysis, cycles per second refer to the number of vibratory cycles that occur in one second of time. Cycles per second is a quantity of frequency.
- Enveloping – Enveloping, also known as envelope de-modulation, is a data processing technique whereby a spectrum is created from a demodulated or filtered waveform.
- FFT – Fast Fourier Transform (FFT) is a mathematical process that transforms a waveform into the components of its frequency spectrum.
- Fmax – Fmax stands for “maximum frequency”. It is the high-frequency boundary for a set of data.
- Fmin – Fmin stands for “minimum frequency”. It is the low-frequency boundary for a set of data.
- Frequency Markers – These are visible marks that can be overlaid on a spectrum at specific frequencies to help identify likely machinery problems.
- Hertz (Hz) – The same as “cycles per second”.
- High Pass Filter (HP) – This filter blocks all data below it and only allows the data that is higher to “pass” and be recorded. It determines the “low-frequency cutoff” or Fmin.
- LOR – LOR stands for “Lines of Resolution”. It is the number of digital bins of amplitude information a spectrum will be constructed from.
- Low Pass Filter (LP) – This filter blocks all data above it and only allows the data that is lower to “pass” and be recorded. It determines the “high-frequency cutoff” or Fmax.
- Negative Averaging – A procedure whereby, having previously taken a reading, a second reading is taken and all data in the first reading that matches data in the second reading is subtracted.
- % Overlap – % overlap is the amount several otherwise sequential waveforms, being sampled and averaged into a spectrum, will “overlap one upon the other” as they are being sampled.
- Peak-to-Peak – The measure of vibration amplitude in a waveform, from the negative peak to the positive peak.
- Unbalance – A measure that quantifies how much the rotor mass centerline is displaced from the centerline of rotation.
- Waveform – In vibration analysis, a waveform is a display of vibratory energy over time.
by Trent Phillips
In the world of vibration analysis frequency is everything. Frequencies are generated by many sources within a machine. The running speed of the machine is one example frequency; this is the velocity of the rotating element which in many cases is a drive shaft connected to an application (like a fan or a pump). Each frequency will have a magnitude associated with it; this is the total amount of energy of that specific frequency. The amount of energy of any given frequency can tell us a lot about what is going on within a machine. When we use a vibration sensor to measure a machine, this is what we are detecting, frequencies, and magnitudes of those frequencies.
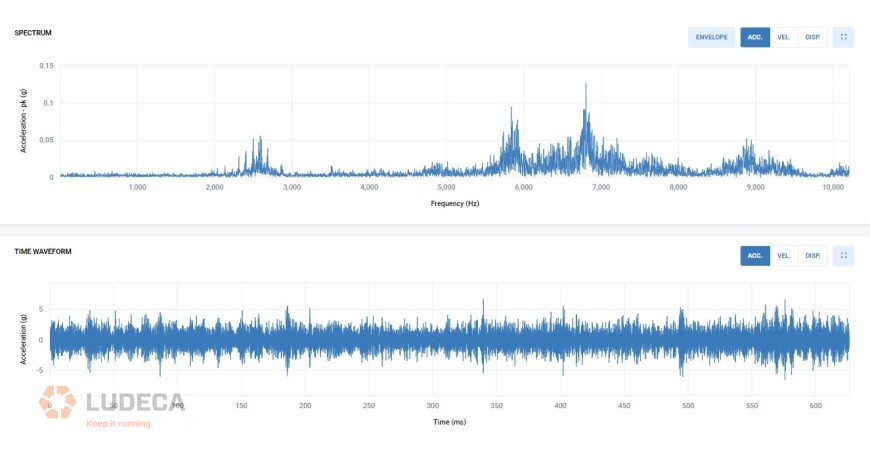
The maximum frequency that a sensor can measure is called the Fmax. This value lets the user know what type of faults they can detect on a machine. It is typically listed in hertz (Hz). The higher the Fmax value, the greater number of faults that a sensor will detect, but it will also allow for earlier indication of potential faults, like a bearing failure. Some ISO standards will reference a Fmax of 1kHz – whilst taking a reading up to 1kHz is suitable for most acceptance testing, it will not highlight even the most basic of bearing faults. A minimum of 2.5kHz Fmax is recommended for good coverage.
Recently, a new sensor has entered the market that boasts a Fmax up to 10kHz. This Fmax gives great coverage for a wide variety of faults, and will accurately inform users of issues on complex equipment like gearboxes that have many higher fault frequencies. In addition, a higher frequency will give an earlier indication of bearing faults. Bearing failures will typically start within the subsurface of the metal with a very small amount of energy being emitted to the sensing element, thus having a sensitive measurement device with the right Fmax is critical to understanding the health of your machine early, prior to failure impacting any processes or causing downtime.
Thank you David Procter with Sensoteq for sharing this educational article with us!
by Diana Pereda
Some vibration software allows for the end user to build a database quickly and easily. For instance, preconfigured machine templates that cover ninety percent of the equipment found in a typical plant is a highly desirable feature.
Below is an example of a motor and pump configuration. The ease and flow of the template allows for quick setup. The option to copy any built template allows for duplicate configurations to be quickly added to the database.
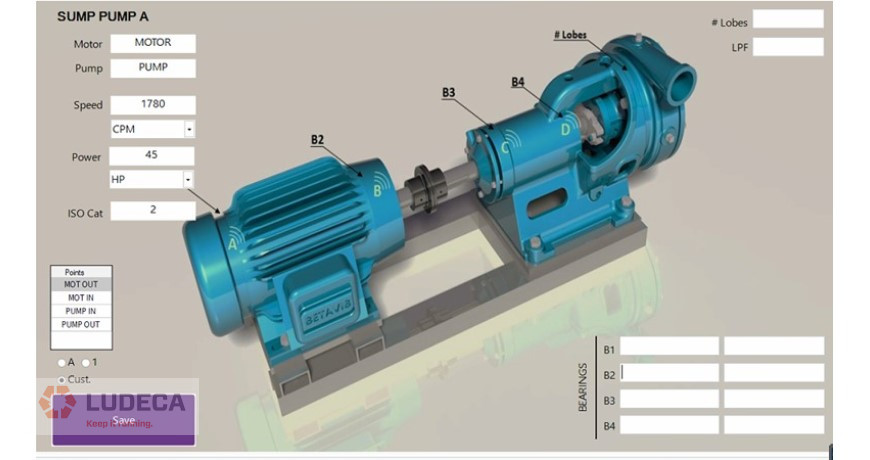
Once the template has all the necessary information and is saved, it builds all the points in three axes (H, V, and A), and automatically assigns a measurement pack to the points of that newly saved template. This saves a lot of time and effort. T measurement pack can be changed after data is collected and reprocessed using new parameters without needing to recollect data on the machine.
Learn more about vibration software capabilities with our BETAVIB Vibworks. Collect, analyze, and report your data plus perform reliable diagnosis & condition monitoring on rotating machines!
Related Blog: The Devil is in the details when it comes to equipment setup in a vibration database
by Diana Pereda
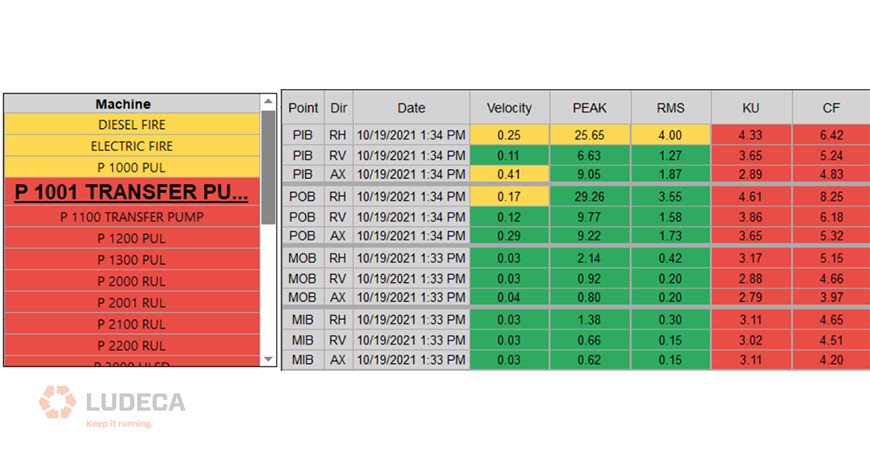
Do you use accurate alarm values for your vibration analysis program or other Condition Monitoring technologies?
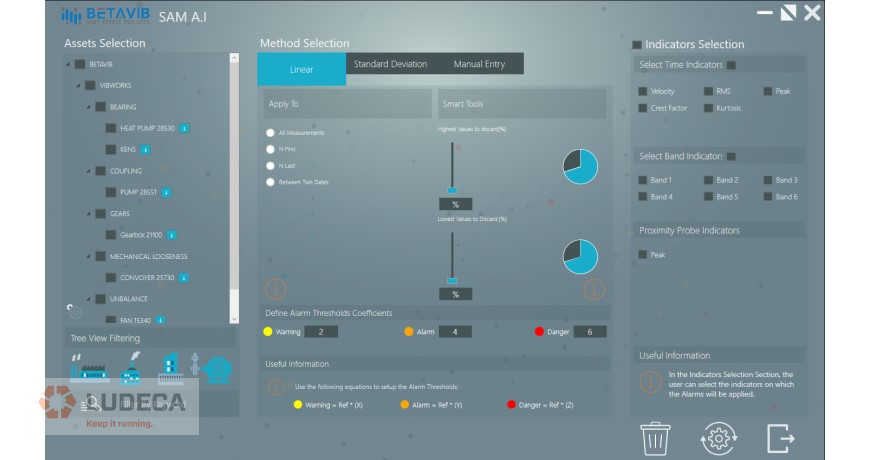
Setting accurate alarm values will help you identify equipment, however, the benefits go beyond this. Missing alarms or inaccurate alarms may force your analyst to review every machine each time data is collected, which wastes a lot of time that could be used more productively for other reliability efforts. Setting accurate vibration alarms ensures that data for each machine does not have to be reviewed each time it is collected. The vibration analysis software, vibration data collector or other CM technology can alert your analyst of those machines that actually need to be reviewed. This will increase the analysis accuracy and save you time and money. There are many tools available with our VibWorks vibration analyzer and data collector to assist the analyst in setting alarms, foremost of which is the SAM, or “Smart Alarm Module”, where alarms can be set or adjusted utilizing Linear, Standard Deviation, or manual entry.
Related Blog: Setting Alarm Values for your Vibration Measurements
by Diana Pereda

Disclaimer: The author is not trying to present himself as an authority on all available CM standards. This blog post is simply an attempt to help those who may be unaware that such guidance exists or of the extent of such standards.
We previously introduced a series of international standards pertaining to condition monitoring of industrial equipment with vibration analysis in, This series ends with the numeric sequence of xx816-x. The original standards from 1974 (ISO 2372) and 1985 (ISO 3945) were replaced or superseded by ISO 10816-1 in 1995. 10816-1 was amended in 2009 and then replaced by ISO 20816-1 in 2016. Next (numerically) is the standard we also mentioned in our previous blog, 20816-2. The dash 2 standard covers the measurement and evaluation of vibration on large land-based gas or steam turbines and generators.
The subsequent standard in the series, the “dash 3” standard is the focus of this blog. This standard is titled:
INTERNATIONAL STANDARD ISO 10816-3
Mechanical vibration — Evaluation of machine vibration by measurements on non-rotating parts
Part 3: Industrial machines with nominal power above 15 kW and nominal speeds between 120 r/min and 15 000 r/min when measured in situ
ISO 10816-3 is the current standard in the series that covers a general range of equipment types and sizes. When first created it was the “catch-all” standard used for many types of machines (such as centrifugal pumps which are now covered by the dash 7 standard) that have since come to be covered by their own specific part of the series. The “10816” issuance of the dash 3 standard is still in force, but to be current it must be joined by a 2017 amendment, “Amendment 1”. This amendment actually modifies the scope of the standard, so it is critical to its being considered current.
The scope of this standard is quoted below from the ISO.org preview page (quotation in bold).
Important Note: The scope shown in the preview cannot be considered current because it is modified by Amendment 1.
Scope:
This part of ISO 10816 gives criteria for assessing vibration levels when measurements are made in situ. The criteria specified apply to machine sets having power above 15 kW and operating speeds between 120 r/min and 15 000 r/min.
The machine sets covered by this part of ISO 10816 include:
- steam turbines with power up to 50 MW
- steam turbine sets with power greater than 50 MW and speeds below 1 500 r/min or above 3 600 r/min (not included in ISO 10816-2)
- rotary compressors
- industrial gas turbines with power up to 3 MW
- generators
- electrical motors of any type
- blowers or fans
NOTE: However, the vibration criteria presented in this part of ISO 10816 are generally only applicable to fans with power ratings greater than 300 kW or fans that are not flexibly supported. As and when circumstances permit, recommendations for other types of fans, including those with lightweight sheet metal construction, will be prepared. Until such time, classifications can be agreed upon between the manufacturer and the customer, using results of previous operational experience, see also ISO 14694[4].
The following are excluded from this part of ISO 10816:
- land-based steam turbine generator sets with power greater than 50 MW and speeds of 1 500 r/min, 1 800 r/min, 3 000 r/min, or 3 600 r/min (see ISO 10816-2)
- gas turbine sets with power greater than 3 MW (see ISO 10816-4)
- machine sets in hydraulic power generating and pumping plants (see ISO 10816-5)
- machines coupled to reciprocating machines (see ISO 10816-6)
- rotodynamic pumps including integrated electric motors, i.e. where the impeller is mounted directly on the motor shaft or is rigidly attached to it (see ISO 10816-7)
- rotary positive displacement compressors (e. g. screw compressors)
- reciprocating compressors
- reciprocating pumps
- submerged motor-pumps
- wind turbines
The criteria of this part of ISO 10816 apply to in situ broad-band vibration measurements taken on the bearings, bearing pedestals, or housing of machines under steady-state operating conditions within the nominal operating speed range. They relate to both acceptance testing and operational monitoring. The evaluation criteria of this part of ISO 10816 are designed to apply to both continuous and non-continuous monitoring situations.
This part of ISO 10816 encompasses machines that may have gears or rolling element bearings but does not address the diagnostic evaluation of the condition of those gears or bearings.
The criteria are applicable only for the vibration produced by the machine set itself and not for vibration which is transmitted to the machine set from external sources.
To read the ISO’s preview of this standard, click here.
by Diana Pereda
The use of a strobe light or stroboscope is another tool in the toolbox of the analyst in the field of Reliability. This tool can be used for a variety of purposes including checking or verifying the rotational speed of a component if the shaft or coupling is accessible.
The user can inspect it without stopping or shutting down the equipment. If the model of stroboscope the user has is capable of being triggered from an external source for the flash rate the user can move the flashing strobe around the machine’s moving parts to see which one appears to stop which can indicate that this is the source for the triggering and therefore the source of vibration.
Most stroboscopes have an output that can send a signal to a vibration instrument to be used as a tachometer input to the instrument. Dynamic balancing can be performed using a stroboscope instead of a laser, optical or infrared tachometer.
A key safety consideration is that one must remember when utilizing a stroboscope that rotating structures (such as shafts or couplings) only appear to be frozen or stopped when the stroboscope flash rate is synchronized to the same frequency as the shaft’s rotational speed.
People who are not familiar with stroboscopes have reached out to touch what appears to be a stopped shaft and become seriously injured. When using a stroboscope and the machine has not been started the user can use a marker and place a horizontal mark on one side of the shaft and a vertical mark on the opposite side so when the machine is running and you adjust the internal oscillator in the stroboscope to match the rotating shaft’s frequency you will either see a vertical or a horizontal mark; if you see a plus sign then the flash frequency is either half or double the shaft frequency.
For a sample on how a strobe light is applied for Synchronous Peaks vs. Non-Synchronous Peaks, watch this video from our partner, Karl Hoffower with Failure Prevention Associates, LLC
by Diana Pereda