If you’ve spent time working with vibration spectra, you’ve probably come across this familiar scenario: a peak shows up close to a known bearing fault frequency but not quite on it. It’s tempting to write it off or over-interpret it, but the truth is, this kind of near-match is both common and worth digging into. Several real world factors can cause these slight deviations. For instance, when the load on a bearing change, it can shift the contact angles inside, which in turn slightly alters the frequencies at which faults manifest. Slippage between rolling elements and raceways especially under heavy loads or inconsistent lubrication can also lead to a mismatch between the theoretical fault frequency and what we actually see in the data.
In the example below and regardless of the low amplitudes: is 7425CPM related to the BPFO :7342CPM?

These effects aren’t just noise; they’re part of the diagnostic puzzle. In the sections that follow, we’ll break down why these differences happen, what they mean, and how to interpret them with more confidence when analyzing spectra.
1. Bearing Fault Frequencies Overview
Ball bearings produce predictable vibration frequencies when defects occur on components such as the inner race, outer race, rolling elements, or cage. These are commonly defined as:

These frequencies are derived from the bearing geometry and the rotational speed of the shaft. However, real world deviations from ideal assumptions such as slippage or axial load can cause these frequencies to shift.
2. Rolling Element Slippage: A Hidden Variable
What is Slippage?
Slippage occurs when rolling elements do not maintain pure rolling motion but slide slightly at the contact points. This is caused by insufficient traction, uneven loading, poor lubrication, or transient motion (e.g., during startup).
How Slippage Affects Fault Frequencies
- BSF is the most sensitive to slippage, decreasing by 2–5% or more in moderate to heavy slip conditions.
- BPFI and BPFO also decrease slightly, typically by 0.5–2%.
- FTF may remain stable or increase marginally.
Condition Estimated Slippage (%)
- Light radial load 0.5 – 1%
- Moderate load 1 – 3%
- High axial/misaligned load 3 – 5%
- Poor lubrication 5 – 10%
These changes, although seemingly small, are enough to cause diagnostic error if theoretical values are used without correction.
3. Axial Load and Contact Angle
Axial Load Increases Contact Angle
When a ball bearing, particularly a deep groove type, is loaded axially, the contact angle (β) increases. This geometric shift alters the path of rolling elements and thus affects fault frequencies.
Bearing Type Typical Contact Angle Range
- Deep Groove Ball 0° to 8° (max ~10° under load)
- Angular Contact 15° to 40° (by design)
Fault Frequency Drift Due to Contact Angle
At a contact angle increase from 0° to 10°: – BPFI increases by ~0.3% – BPFO decreases by ~0.5% – BSF increases by ~0.2% – FTF may slightly decrease or stay stable. This occurs because the path length and angular relationship between the rolling elements and raceways change, especially for BPFI and BSF.
4. Combined Effects: Slippage vs. Axial Load
These two effects can oppose or compound each other:
Frequency Slippage Effect Axial Load Effect Net Result
- BPFI ↓ Decreases ↑ Increases May offset each other
- BPFO ↓ Decreases ↓ Decreases Additive decrease
- BSF ↓ Strong decrease ↑ Slight increase Likely net decrease
- FTF → Stable / ↑ → Stable / ↓ Minimal change
For example, an inner race defect might show a BPFI slightly below theoretical, not because the geometry is wrong, but because slippage is countering the contact angle increase.
5. Practical Implications for Diagnostics
- Always allow for 2–3% tolerance when matching spectral peaks to calculated fault frequencies.
- Consider operational context: high axial load may suggest increased BPFI, but slippage could mask this.
- Use time waveform and phase data alongside spectra to identify ball-pass events more reliably.
- Employ a slippage-corrected calculator when working with low-speed or poorly lubricated bearings.
6. Effect of Rotational Speed on Diagnostic Clarity
Rotational speed amplifies the consequences of slippage and contact angle variation. While the percentage drift in fault frequencies due to these factors remains relatively constant, the absolute drift in Hertz (Hz) or CPM becomes more significant at higher speeds.
For example: – At 1800 CPM (30 Hz), a 2% shift in BPFI corresponds to roughly 3 Hz or 180 CPM. – At 3600 CPM (60 Hz), that same 2% shift becomes 6 Hz or 360 CPM. – At 6000+ CPM, it could exceed 10 Hz, making it increasingly difficult to confidently match spectral peaks.
This drift becomes especially problematic when fault frequencies are close to integer multiples of the shaft speed (1×, 2×, etc.). Even a small shift can make a true bearing fault peak appear blended with harmonics or misidentified as gear mesh, belt pass, or structural resonance.
Diagnostic Risk:
- A slipped BSF may align too closely with a harmonic and be missed entirely.
- A drifted BPFI may appear between 4× and 5× shaft speed and be overlooked if an analyst expects perfect alignment.
Best Practices:
- Always compare both frequency and phase information.
- Use sideband patterns and time waveform analysis to distinguish overlapping sources.
- Maintain a tolerance band of ±2–3% (or more at higher speeds) when matching peaks to theoretical fault frequencies.
Conclusion:
In bearing fault diagnostics, precision matters but so does realism. Rolling element slippage and axial loading are normal phenomena in rotating machinery. By understanding how they influence fault frequencies, analysts can improve diagnostic accuracy, reduce false positives, and better predict failure severity. Incorporating both factors into spectral interpretation leads to smarter, more reliable condition monitoring.
Thank you Betavib for sharing this informative article with us!
by Diana Pereda

Across the world, bearings are destroyed in rotating equipment every day. As maintenance professionals, we have all been made aware of poor lubrication, misalignment, unbalance, and other mechanical anomalies that lead to bearing failures. However, over the last few decades there has been an upswing in bearing failures caused by electrical issues. This upswing happened with the widespread introduction of Variable Frequency Drives (VFDs). The problem is electrical fluting.
What is Fluting?
Fluting is a description of the physical effect on bearings after the electrical defects have already caused damage. So, we need to back up for a minute to the root cause and then come back to fluting.
When a motor operates on a Variable Frequency Drive (VFD) there is an excessive amount of capacitance between the rotor and the stator in the motor. This capacitance is caused by the switching frequency in the VFD. A VFD takes Alternating Current (AC) voltage and converts it to Direct Current (DC), then back to AC through a process called Pulse Width Modulation (PWM). This pulsing or PWM is controlled by Insulated Gate Bipolar Transistors or (IGBTs). The purpose of this pulsing is to introduce the ability to vary the frequency and control the speed of the motor. Hence the name VFD. Although VFDs are a great invention that has saved tons of money in energy costs and improved the efficiency of factories across the world, they come with a downside.
When AC power is “recreated” through PWM it can cause a few unwanted forms of noise, including electromagnetic interference (EMI), radio frequency interference (RFI) and common mode current. These unwanted variables can lead to the buildup of capacitance in the motor. This causes voltage to build up in the motor shaft. When the voltage has reached a high enough level, it will arc across the bearing rollers into the motor frame as it tries to find the easiest path to ground. Unfortunately, this arcing occurs directly onto the bearing race!
So, what’s the harm?
Electrical arcing in rolling element bearings can cause major problems over time. At low levels, it can take years to develop physical damage in the bearing. However, high levels of shaft voltage, the arcing can destroy a bearing quite quickly. When arcing occurs in the bearing, it produces small pits in the race. Over time, as these pits accumulate, they become like waves in the bearing race and end up looking like a washboard. As you can imagine, this will generate quite a lot of noise as rollers pass over a surface that was once smooth but now resembles a washboard. The sound of fluted bearings can be extremely annoying! Excessive bearing noise can become especially problematic in schools, office buildings, and hospitals. Not only are fluted bearings an inconvenience for nearby workers dealing with the sound, but they can also fail prematurely. Anytime fluted bearings are identified, they should be changed as soon as possible. Or at least monitored closely with vibration or ultrasonic analysis.
How to Identify Fluting
Unfortunately, fluted bearings are most often identified by excessive noise levels. This is a major problem because the damage is already done by the time we can hear it. Damage in the bearing can be picked up early with vibration analysis as well as ultrasonic analysis. The vibration spectrum will identify a race defect with many harmonics that are very widespread across the frequency range, and very similar in amplitude. While using these techniques is better than waiting for audible noise, it’s still too late. The damage has already been done!
Electrical testing can be performed to see if the potential for fluting is present. A shaft riding device can be used to measure voltage on the motor shaft. We recommend leaving this to a professional. An oscilloscope can be used on the leads going to the motor to measure common mode current. This is a good indication that bearing fluting is imminent.
How to prevent Fluting
Although early detection is best for predicting bearing failures from fluting, it is best to put measures in place to prevent fluting altogether. Most Google searches and articles about fluting will discuss many Band-Aid fixes that mask or delay the effects of fluting. However, fluting can be mostly avoided if installations are set up properly from the beginning.
Here are some measures that can be put in place if fluting is already a problem:
- Shaft grounding devices: These can come in the form of brushes or rings. They are quite effective at grounding the shaft and avoiding arcing in the bearings. They give the voltage an easy path to ground. However, they are a bit challenging to install and require constant maintenance.
- Inductive Absorbers/Filters/Chokes: There are several products on the market for reducing unwanted common mode current right at the VFD. These are often called filters or chokes. These chokes simply slide right over the leads going to the motor and absorb the unwanted electromagnetic interference (EMI) as well as radio frequency interference (RFI) before it even gets to the motor. These are very easy to install and require no further maintenance. One of the more popular brands of these filters is CoolBLUE®.
- Use Proper Lubrication: Some lubrication is more conductive than others. Always use non-conductive grease in motor bearings. This will greatly reduce the amount of arcing that occurs in the bearings.
- Insulated bearings: These bearings can eliminate the arcing from the roller to the race. They can be coated or made of insulating material such as ceramic. Although insulated bearings can solve the fluting problem, they are quite costly and can be difficult to obtain.
Although the above practices can greatly reduce the effect of unwanted shaft voltage, it is best to avoid the problem during installation by ensuring that the machine is set up properly. Here are a few tips to consider when installing equipment that runs on a VFD.
- Make sure the VFD is sized properly for the machine. Consider horsepower, amperage requirement, load, etc.
- Communicate with the VFD manufacturer or distributor and use the VFD that is recommended for your specific application. Be sure to include all details so the proper set-up can be provided.
- Use VFD-rated cabling to the motor. Using this type of cabling greatly reduces the effect of common mode (stray) current, radio frequency interference (RFI), electromagnetic interference (EMI), and any other unwanted noise from the VFD.
- Ensure that your grounding system is sufficient. The better your grounding system is, the less effect fluting will have on your facility. Keep your ground system in good working order and keep your power clean. It won’t do much good to ground motor shafts with rings or brushes if there isn’t a good path to ground from there.
- Avoid running ground cables in the same conduit as the power leads. If the cabling is run together, the power leads can induce current into the ground cable and exacerbate the problem of stray currents. This can ultimately cause a direct circuit for stray currents to flow from the VFD, through the motor, into the motor frame, and back to the VFD. Try to run ground cables separately to the machine.
How to correct fluted bearings
So, what do you do if your bearings are already fluted? It goes without saying that fluted bearings should be replaced as soon as possible. If harmonics are observed in the vibration data, or noise is heard from the bearings, there is already physical damage to the bearing race. It is best to change the bearings as soon as possible to avoid unwanted downtime from a catastrophic failure.
Often, when maintenance professionals find fluted bearings, they want to jump straight to grounding or filtering. This is smart, but if bearings are already fluted, the corrective methods for VFD noise will not correct the physical damage already present in the bearing. It must be replaced, period.
It would be wise to not place new bearings into a machine that has issues with excessive shaft voltage. The shaft voltage issue must be corrected first. Damage to bearings can occur quickly and continue to progress long after the electrical issue has been resolved. With that said, don’t change the bearings and run them for two months while you wait on filters or grounding rings!
Key Takeaways
- Always follow manufacturer’s recommendations when purchasing and installing VFD operated machines.
- Ensure that each motor is VFD rated or “Inverter Duty”. This will be indicated on the motor’s nameplate.
- Always maintain a good grounding system in your facility. Be sure to periodically inspect the grounding system as modifications are made and new machines are added.
- Once machines are installed, perform early electrical testing to identify any issue that may lead to fluting.
- Install grounding rings, brushes, filters, or absorbers as needed if problems are detected.
- Maintain a robust reliability program including vibration analysis and/or ultrasonic testing. This can identify any damage that may have slipped by.
- Always use the correct lubrication for motor bearings to minimize the effects of electrical damage.
Conclusion
Electrical fluting is thought to be a new problem that has developed over the last 20 years with the rapid increase in VFDs. However, fluting is not a new thing at all. Many DC motors run on drives that convert AC power to DC to vary the speed. Fluting has been an issue in DC motors for quite some time. Furthermore, fluting was also around before any drives were created. Certain electrical circuits and motor constructions can create the perfect environment for fluting to occur.
Now that VFDs are extremely common across all industries, we must get used to preventing, minimizing, and correcting issues that lead to fluted bearings.
Download our 4 Stages Bearing Failures infographic for a basic reference guide to understanding the stages of bearing failures. Perfect to hang at your facility too!
by Diana Pereda
For people working in the Condition Monitoring field, the sheer number of online systems being advertised in trade magazines and their advertised capabilities create both excitement and confusion.
Why has there been such a surge in online systems over the past few years?
- Manufacturing is focused on what’s being called “Digital Factory”. Critical assets can be controlled and can communicate information via digital links. This allows the health of critical machines to be determined in real time. This vision resonates with many corporations which then helps to push the implementation of these systems to the front of the line.
- The cost involved in implementing online systems is much lower now than it was 10 years ago because of advancements in technology. The use of wireless sensors eliminates the cost of running conduit and sensor cables. In addition, since most online systems are web-based, the costs of a network server, software, and database administration are practically eliminated. The vibration data, via Wi-Fi, can be transmitted to the cloud, with the user only paying a subscription fee.
Online Systems Benefits:
- Data can be collected at any time of the day or as many times, a day as needed without any additional cost. The ability to modify and shorten data collection intervals is a huge advantage, especially when the asset cannot be scheduled for immediate repair due to production schedules. The online system also has an advantage because new data can be collected without the requirement of on-site labor.
- Data can be reviewed from anywhere.
- Alarms can identify a machine that is in trouble.
- The system is set-and-go and the alarm is set according to ISO standards.
One feature of online systems is the ability to warn users when a machine trips an alarm. The most popular type of alarm utilized is the overall vibration level. When the overall amplitude threshold is reached the alarm is triggered, and in most systems emails and text messages can be sent out to a pre-determined group of people needing to be notified. However, overall vibration alarms simply announce that the condition of the monitored machine has changed.
Overall Alarms do “NOT” provide the reason or cause for the change in condition of the machine.
To answer the question of “WHY” the machine triggered the overall alarm someone who has training in vibration analysis will need to look at the data to determine the root cause.
Proper setup of alarms can be a tricky and often long process. Alarms must be established which allow for the normal operation of the machine during operation. However, they must be close enough to the operating vibration level to alert users to changes in the condition of a machine. Extreme caution must be exercised so that alarms are not defined which ultimately results in a large number of nuisance alarms being generated. This is probably the fastest way to kill a condition monitoring program at a facility. Most facilities do not have the workforce required or the budget needed to address the problems identified on such short notice. This results in operations personnel and maintenance staff simply ignoring the alarms and in some cases even disabling them.
Why Monitor Online? 8 More Reasons to Consider an Online Monitoring System
by Diana Pereda
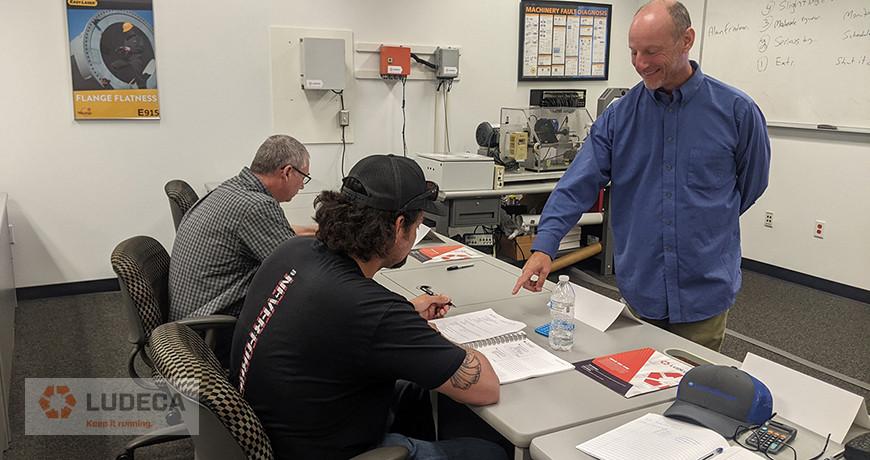
With training funds being difficult to obtain these days it is critical that we do everything possible to have a satisfactory and productive training experience. This includes evaluating whether it would be more cost-effective to attend a training class off-site (such as at a vendor’s facility) or have the course conducted at your facility.
There are advantages and disadvantages to both. Typically, if multiple personnel from your facility will be attending it could be more cost-effective to have the course presented in-house at your facility. This would eliminate travel costs, per diems, etc. for your personnel. If only one or two individuals are attending, then it might be more cost-effective to attend the course off-site at the vendor’s training center. Also, attending a course off-site may remove you from the internal distractions and interruptions that occur from being in the plant environment during the training course. When you decide to attend a training course you have the right to expect that the course will be presented in a professional manner by an instructor who knows the material and subject matter.
by Gary James CRL

Disclaimer: The author is not attempting to present himself as an authority on all available CM standards. This blog is simply an attempt to help those who may be unaware that such guidance exists or of the extent of such standards.
We previously discussed a series of international standards pertaining to condition monitoring of industrial equipment with vibration analysis in, Condition Monitoring & Vibration Classification Standards Awareness: Part 10 ISO 13373-1:2002This blog is number 11 in a series of blogs describing some international standards as a help to our Ludeca partners. This blog is about the ISO 14694:2003 standard that concerns itself with “Industrial fans” and specifically provides guidance and framework for arriving at acceptable operating vibration levels due to unbalance, as well as acceptance (start-up) levels. It deals with fans used for different applications and offers guidance for determining start-up (acceptance), alarm, and shut-down levels for fans used in the differing applications.
The following three paragraphs are from the ISO introduction to the 14694:2003 standard:
“ISO 14694 is a part of a series of standards covering important aspects of fans which affect their design, manufacture and use. This series includes ISO 5801, ISO 5802, ISO 12499, ISO 13347, ISO 13348, ISO 13349, ISO 13350, ISO 13351, ISO 14695 and CEN/BTS 2/AH 17.
This International Standard addresses the needs of both users and manufacturers of fan equipment for a technically accurate but uncomplicated set of information on the subjects of balance precision and vibration levels.
Vibration is recognized as an important parameter in the description of the performance of fans. It gives an indication of how well the fan has been designed and constructed and can forewarn of possible operational problems. These problems may be associated with inadequacies of support structures and machine deterioration, etc.”
There are at least 5 notable tables in this standard:
Table 1 Fan application categories
Table 2 Balance quality grades
Table 3 Percentage of total available clearance within the bearing in each axis
Table 4 Vibration-levels limit for test in manufacturer’s workshop
Table 5 Seismic vibration limits for tests conducted in situ
This standard is titled:
ISO 14694:2003
Industrial fans — Specifications for balance quality and vibration levels
The scope of this standard is quoted below from the ISO.org preview page (quotation in bold):
Scope:
This International Standard gives specifications for vibration and balance limits of fans for all applications except those designed solely for air circulation, for example, ceiling fans and table fans. However, it is limited to fans of all types installed with a power of less than 300 kW or to a commercially available standard electric motor with a maximum power of 355 kW (following an R20 series). For fans of greater power than this, the applicable limits are those given in ISO 10816-3. Where the fans in an installation have varying powers both above and below 300 kW, and have been the subject of a single contract, then the manufacturer and purchaser shall agree on the appropriate standard to be used. This should normally be based on the majority of units.
Vibration data may be required for a variety of purposes as detailed in Clause 5.
The International Standard recognizes that vibrational measurements may be recorded as velocity, acceleration or displacement either in absolute units or in decibels above a given reference level. The magnitude of vibration measurements may be affected by assembly practices at balancing machines (see Annex B). The preferred parameter is, however, the velocity, in millimeters per second (mm/s). As the conventions vary in different parts of the world, both r.m.s. (root mean square) and peak-to-peak or peak values are given. It should also be remembered that a fan and its parts may be considered as a spring-mass system. An understanding of this fact helps to resolve most vibrational problems (see Annex D).
Account has also been taken of the fact that factory tests are usually conducted with the fan unconnected to a ducting system, such that its aerodynamic duty may be considerably different from that during normal operation. It may also be supported on temporary foundations of different mass and stiffness to those used in situ. Accordingly, such tests are specified with vibration measured “filter-in”. In situ tests are specified “filter-out” and as such represent a measure of overall vibration severity.
This International Standard covers fan equipment with rigid rotors, generally found in: commercial heating, ventilating and air conditioning, industrial processes, mine/tunnel ventilation and power-generation applications. Other applications are not specifically excluded. Excluded are installations which involve severe forces, impacts or extreme temperatures. Any or all portions of this International Standard, or modifications thereof, are subject to agreement between the parties concerned.
Fan-equipment foundations and installation practices are beyond the scope of this International Standard. Foundation design and fan installation are not normally the responsibilities of the fan manufacturer. It is fully expected that the foundations upon which the fan is mounted will provide the support and stability necessary to meet the vibration criteria of the fan as it is delivered from the factory.
Other factors, such as impeller cleanliness, aerodynamic conditions, background vibration, operation at speeds other than those agreed upon, and maintenance of the fan, affect the fan-vibration levels but are beyond the scope of this International Standard.
This International Standard is intended to cover only the balance or vibration of the fan and does not take into account the effect of fan vibration on personnel, equipment or processes.
To read the ISO’s preview of this standard, click here.
This concludes our series of planned standards blog posts. Requests for further informational blogs on standards will be considered. Thank you for your attention.
by Diana Pereda

Disclaimer: The author is not trying to present himself as an authority on all available CM standards. This blog post is simply an attempt to help those who may be unaware that such guidance exists or of the extent of such standards.
We previously discussed a series of international standards pertaining to condition monitoring of industrial equipment with vibration analysis in, Condition Monitoring & Vibration Classification Standards Awareness: Part 9 ISO 10816-21:2015 This blog is number 10 in a series of blogs describing some international standards as a help to our Ludeca partners. This blog is about the ISO 13373-1 standard that concerns itself with “General Procedures”. i.e., the procedures relied upon in the subsequent series of standards targeting the more specific elements of which vibration condition monitoring and diagnostics are comprised of.
The following two paragraphs are from the ISO introduction to the 13373-1 standard: “The measurement methods described in this part of ISO 13373 reflect current common methods of measurements utilizing seismic and non-contacting vibration transducers. However, it is recognized that other methods of assessing the vibration condition of machines are in development. Although not included at this time, this part of ISO 13373 does not preclude the use of such measurement techniques.
ISO/TC 108 is at present also in the process of developing new International Standards on the subject of Machinery Diagnostics. These International Standards are intended to provide guidance on the overall monitoring of the “health” of machines, including factors such as vibration, tribology, oil purity and thermography.”
This standard is titled:
ISO 13373-1 :2002
Condition monitoring and diagnostics of machines -Vibration condition monitoring
Part 1: General procedures
The scope of this standard is quoted below from the ISO.org preview page (quotation in bold):
Scope:
This part of ISO 13373 provides general guidelines for the measurement and data collection functions of machinery vibration for condition monitoring. It is intended to promote consistency of measurement procedures and practices, which usually concentrate on rotating machines. Because of the diversity of approaches to condition monitoring, recommendations specific to a particular kind of monitoring programme will be addressed in additional parts of ISO 13373.
This part of ISO 13373 is a basic document which presents recommendations of a general nature, encompassing:
- measurement methods,
- measurement parameters,
- transducer selection,
- transducer location,
- transducer attachment,
- data collection,
- machine operating conditions,
- vibration monitoring systems,
- signal conditioning systems,
- interfaces with data-processing systems,
- continuous monitoring, and
- periodic monitoring.
The vibratory conditions of a machine can be monitored by vibration measurements on the bearing or housing structure and/or by vibration measurements of the rotating elements of the machine. In addition, measurements can be continuous or non-continuous. This part of ISO 13373 provides guidance on the types of measurements recommended in both the continuous and the non-continuous modes.
It is emphasized that this part of ISO 13373 addresses only the procedures for vibration condition monitoring of machines. In many cases, the complete condition monitoring and diagnostics of a machine can also include other parameters, such as thermography, oil analysis, ferrography, process variations, temperatures and pressures. These non-vibratory parameters will be included in other International Standards.
This part of ISO 13373 covers rotating machines. However, many of the procedures included can be applied to other types of machines, for example reciprocating machines.
To read the ISO’s preview of this standard, click here.
Requests for further informational blogs on standards will be considered. Thank you for your attention.
by Diana Pereda
‘The Cloud’ refers to software, services, and data that are stored on the internet. However, this data is not just stored in a random location; it will be located on a group of computers operated by a service provider. Typically it will be Microsoft, Amazon, or Google, but other providers are available. These companies have vast arrays of computer servers located in Data Centers around the world, and your data will be kept in one or more of these data centers – and generally restricted to one region (for example, the US or EU) upon request.
Cloud technology can provide a huge amount of benefits when used and implemented correctly. It can greatly reduce the risk of data loss because of how cloud providers offer managed services to handle backups and failover systems.
For a condition monitoring platform using the cloud, it is essential that sensor data reaches the cloud using a secure method. Gateways, or base stations, that send vital condition monitoring data to the cloud do so using secure network protocols and encryption. Data sent using SSH, IPsec, PGP or TLS/SSL with encryptions such as AES, 3DES or RSA are industry standard. This makes the connection very robust helping to keep your data safe on the internet. Once the data reaches the cloud, it is good practice to further encrypt the data whilst being held in the database (encrypted at rest) using the same or similar methods highlighted above.
Using an internet connection and browser, an authorized user will have access to the data from anywhere in the world. User login credentials require a token (access to the encrypted data at rest) to safely and securely view valuable condition monitoring data.
Other technologies, such as machine learning, can also utilize the superior computing power that comes from the cloud, giving automated intelligence to any machine that is monitored.
Some scenarios will not be suitable for cloud computing, such as sites that do not have an internet connection, or require an offline system. However, many typical systems can benefit from adopting a cloud-based condition monitoring platform and strategy.
Thank you David Procter with Sensoteq for sharing this informative blog with us!
Wireless Vibration Monitoring: How to benefit from an IoT Solution at your facility
by Diana Pereda
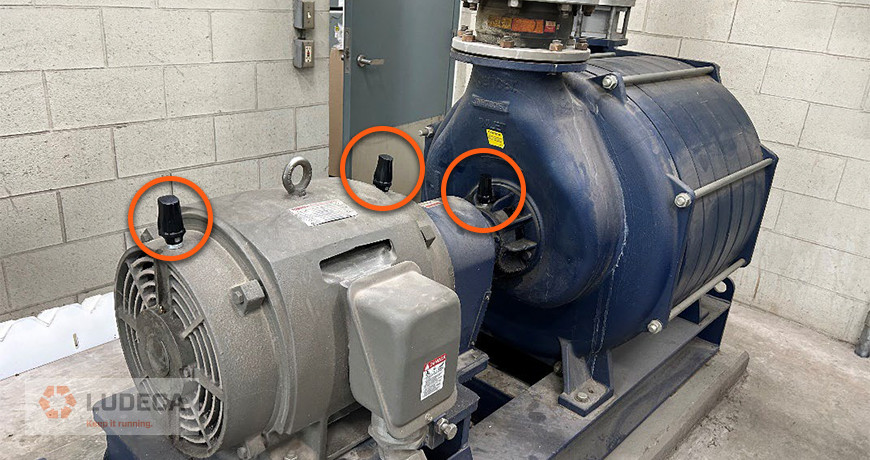
In the wastewater treatment industry, uninterrupted aeration is crucial for effective operation and compliance with environmental regulations. When a Wastewater Treatment Plant (WWTP) experienced a major bearing failure in two of their high-speed, high-temperature blowers, it posed a significant challenge. The blower manufacturer had no spare parts or replacements available, leaving the plant at risk of EPA issues and costly downtime. This case study highlights how the implementation of Sensoteq’s KAPPA X wireless monitoring solution provided crucial support, proactive maintenance, and prevented further damage to critical equipment.
The WWTP faced an urgent need to address the bearing failure in their blowers, as it jeopardized their aeration process. With no spare parts or replacement blowers immediately available, they were forced to rent a blower system at a substantial cost while the damaged blowers were being rebuilt. The plant’s time-sensitive operations demanded a reliable monitoring system that could alert maintenance personnel to potential issues before catastrophic failures occurred.
Recognizing the importance of continuous support and 24-hour monitoring, the WWTP turned to LUDECA for a solution. The KAPPA X wireless vibration monitoring system was chosen for its ability to set thresholds and alarms, providing real-time notifications of any abnormalities by email or SMS text. This would enable the plant’s maintenance team to promptly respond, shutting down units before secondary damage occurred. The implementation of the KAPPA X system allowed for proactive maintenance practices and ensured the integrity of critical equipment.
Click here to continue reading this case study and find out the benefits in using our KAPPA X wireless vibration monitoring system!
by Diana Pereda
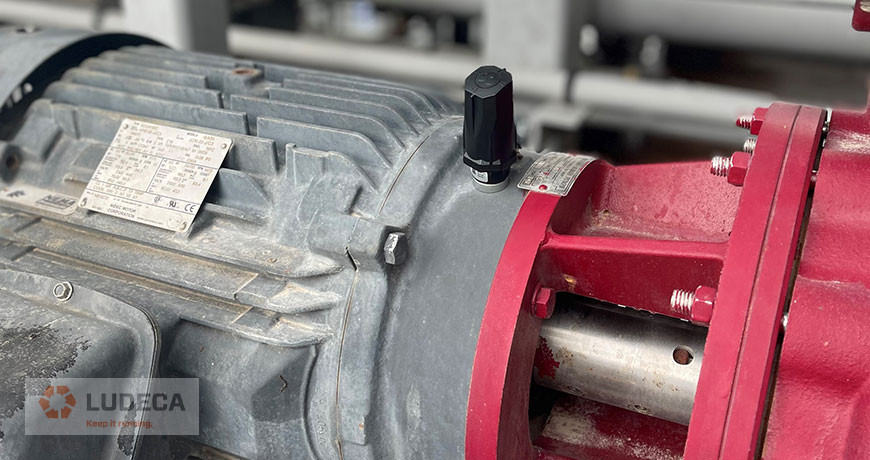
When choosing a wireless vibration sensor, it is important to carefully evaluate your specific application requirements and weigh the advantages of the technology to make an informed decision. Here are some advantages of wireless vibration sensors:
- Flexibility and Mobility: Wireless sensors such as the Kappa X provide greater flexibility in terms of placement and movement. This is especially beneficial in applications where it’s challenging or impractical to use wired connections.
- Ease of Installation: Installation of wireless vibration sensors is generally simpler and quicker since they do not require the installation of cables. This can result in cost savings, especially in retrofitting or dynamic environments.
- Scalability: Wireless systems are often more scalable, allowing for the easy addition of new sensors without the need for extensive cabling. This can be advantageous in expanding monitoring capabilities as needed.
- Suitability for Remote or Harsh Environments: In environments where running cables is challenging or impractical, or where equipment is located in remote areas, in an explosive environment, or harsh conditions for portable data collection, wireless sensors offer a viable solution.
- Instant Notifications: Configurable on wireless vibration sensors, real-time alerts can be sent through email or SMS text the moment vibration levels surpass predetermined thresholds. This enables operations and maintenance personnel to promptly address issues and prevent potential equipment failure.
by Diana Pereda
These 10 rights were taken from the book: Audit It. Improve It! Getting the Most from your Vibration Monitoring Program by Alan Friedman.
- Right Goals: Having clearly defined and achievable goals that may evolve over time.
- Right People: Having the right people in the right roles with the right condition monitoring training.
- Right Leadership: Inspiring continuous improvement.
- Right Tools: Having the right condition monitoring tools and technology to help reach the goal.
- Right Understanding: Equipment audits, reliability, and criticality audits, FMEA, etc.
- Right Data Collection: Collecting the right data in time to detect defects or impending failures.
- Right Analysis: Turning data into defect or fault diagnoses and actionable info.
- Right Reporting: Getting info to the right people, at the right time, in the right format.
- Right Follow-up and Review: Acting on reports, verifying results, bench-making, auditing improvements, etc.
- Right Processes and Procedures: Tying together people, technology, info, decision-making, and review.
by Diana Pereda
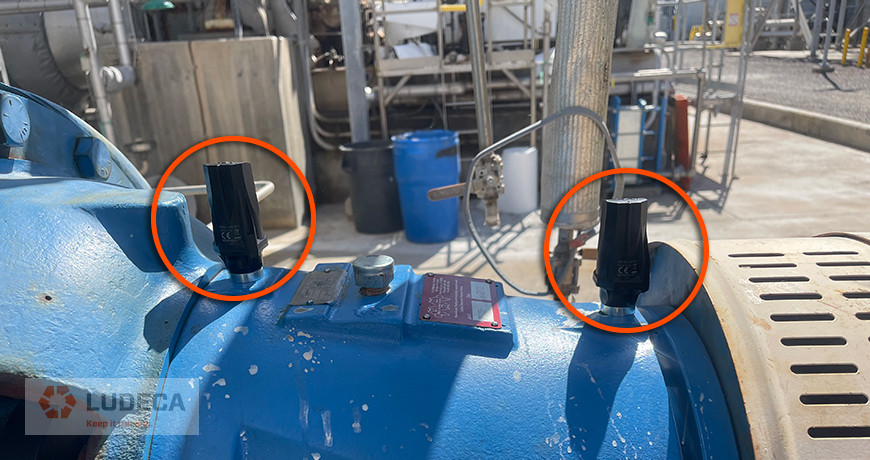
One of the largest power plants in the United States experienced issues with two out of three recirculating pumps, which are critical for generating power. Despite regular monthly vibration route data collection, the pumps were running louder than normal, indicating a potential problem. To avoid a complete failure that would halt power generation, the plant implemented continuous monitoring using Sensoteq’s KAPPA X wireless vibration sensor from LUDECA on one of the recirculation pumps.
CHALLENGES
- Criticality: The recirculating pumps are essential for generating power by providing DeIonized Water (DI Water) to produce steam for the steam turbines. A pump failure would result in a complete power outage.
- Cost and Lead Time: Replacing a pump was estimated to cost $120,000 and would take approximately 16 weeks, causing significant financial and operational setbacks for the power plant. The ZLD area at which the pump operates is also critical to clean up the pond water to ensure the site also maintains zero liquid discharge from the facility, thus recycling all water and ensuring maximum sustainability of the most precious resource at any power plant, especially in the desert, that being water.
Click here to continue reading this case study and find out what steps were taken to get the project started and the results achieved after implementing continuous monitoring using the KAPPA X wireless vibration sensor!
by Diana Pereda
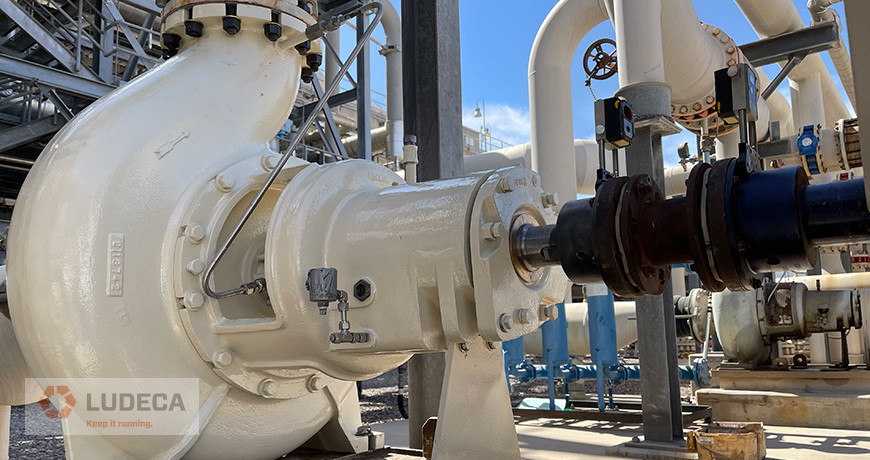
A pump is a machine or device designed to move and transfer fluids. All pumps basically do the same thing, and the pump best suited for your needs depends on how far, how fast, and how much fluid needs to be transferred. Pumps are very critical to a facility as a whole and unwanted downtime can cause production to cease. There are many manufacturers of pumps such as Goulds, Sulzer, and Sundyne to name but a few. Monitoring a pump with a handheld vibration data collector such as BETAVIB’s VibWorks or using an online condition monitoring system like a Cortex system, enables a facility to save money and avoid unplanned downtime.
Many different mechanical issues can cause a pump to fail. Fortunately, machine data is stored in VibWorks software, which provides additional capabilities for programming, trending, evaluation, and archiving of the machinery condition. Vibration monitoring allows for many things to be recorded such as:
- Looseness
- Misalignment
- Bearing Defects
- Imbalance
- Pump Cavitation
One of the most important things to remember about a pump is the size needed for the application. Too many facilities have either oversized or undersized pumps, which can cause the pump to run above or below its ideal pumping curve. The pumping characteristic is normally described graphically by the manufacturer as a pump performance curve. The pump curve describes the relation between flow rate and head. A pump running off its intended curve can cause damage and result in poor performance.
Laser Alignment for a Vertical Water Pump with Easy-Laser XT
by Ana Maria Delgado, CRL
In today’s world-class facilities, maintenance and reliability departments require data collection on a consistent and periodic basis to guarantee that assets in a plant operate efficiently and reliably.
Vibration monitoring actively monitors the health of critical assets for potential failure conditions. This yields great results in identifying potential failure conditions for repair before unwanted downtime or other costly consequences are experienced.
Typical walk-around vibration programs can take time to establish and get going, whereas online condition monitoring can be expensive due to the installation costs including labor, cables, sensors, etc. Moreover, a cabled installation might even be impossible in certain situations due to accessibility issues.
On the other hand, an IoT solution such as wireless technology can solve all of these problems and is an ideal solution for most facilities. Having a wireless vibration program with smart sensing technology is cost-effective for all manufacturing applications. A wireless vibration solution such as the Sensoteq Kappa X with prolonged battery life, a Fmax of 10kHz, and 6400 lines of resolution with signal analysis with enveloping can provide unparallel level of diagnostic capabilities and asset health monitoring of your plant machinery.
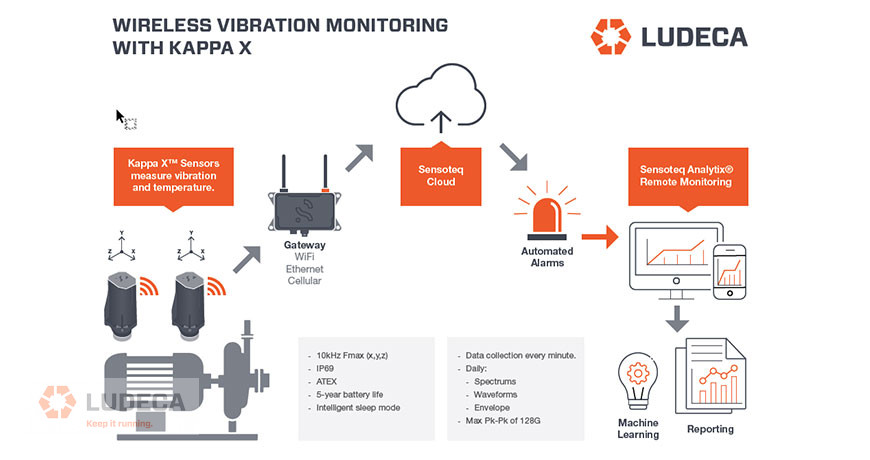
Data can be viewed from anywhere in the world and you can be notified of any issue arising in your assets via either a PC or mobile device, and the data can also be seamlessly entered into your facility’s PLC or DCS system.
by Ana Maria Delgado, CRL
Reliability groups are often expected to collect data on critical assets in a consistent manner to ensure the asset’s health is monitored efficiently, and to maximize the life of that equipment. Doing this task manually may pose a safety or health risk to the personnel responsible for collecting the data. One of the solutions is to install permanently mounted sensors and wire them to a termination/switch box in a safe location.
It is important to note that there are several ways to permanently mount sensors to an asset, but the most common are:
Adhesive Mount
As the name says, this process entails utilizing a strong epoxy-like adhesive that creates a sturdy bond between the sensor and the asset. It is imperative that the two surfaces be thoroughly stripped of any paint and/or corrosion using a steel wire brush. This should be done to remove any surface imperfections that can compromise the integrity of the bond between the sensor and the asset, as well as remove signal dampening layers between the sensor and the machine.
Drilling and Tapping Mount
This process entails physically drilling a small pilot hole into the casing of the asset and then tapping the hole to match the thread of the stud included with the chosen sensor. This method is one of the preferred methods in the industry as it ensures a perfectly solid mount between the sensor and the asset.
Switch Box Vibration Data Collection
For either of the above methods, cabling must be routed to provide communication. It is of the utmost importance to route the cable through suitable conduits so that it is protected from harsh temperatures or chemical exposure that can potentially cause damage. Utilizing a label machine to identify each cable will ensure that the final wiring in the termination/switch box is accomplished properly and easily. Once the physical installation of the permanently mounted sensors and wiring is completed, the reliability technician that oversees the Condition Monitoring program can safely and efficiently collect data with the help of a capable data collector such as the BETAVIB’s VibWorks system. This will greatly improve the uptime of a facility’s assets and help maintain world-class reliability while maximizing the safety of its employees.
The importance of proper sensor installation when performing vibration analysis
by Ana Maria Delgado, CRL
In the world of vibration analysis frequency is everything. Frequencies are generated by many sources within a machine. The running speed of the machine is one example frequency; this is the velocity of the rotating element which in many cases is a drive shaft connected to an application (like a fan or a pump). Each frequency will have a magnitude associated with it; this is the total amount of energy of that specific frequency. The amount of energy of any given frequency can tell us a lot about what is going on within a machine. When we use a vibration sensor to measure a machine, this is what we are detecting, frequencies, and magnitudes of those frequencies.
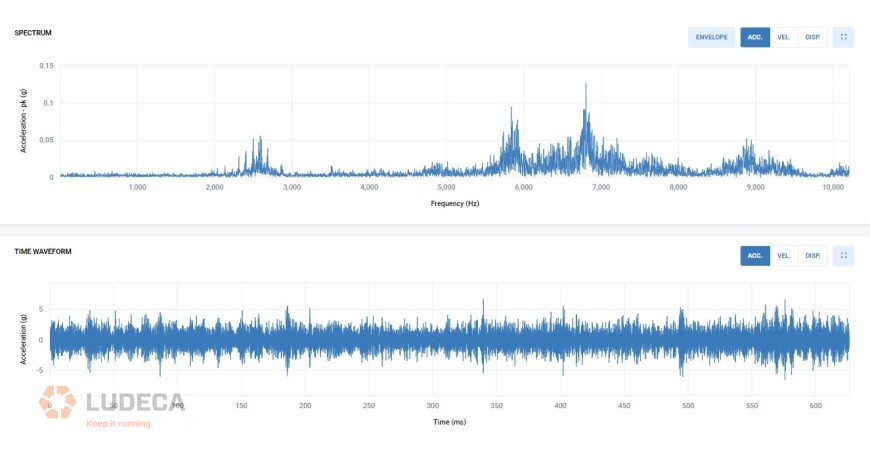
The maximum frequency that a sensor can measure is called the Fmax. This value lets the user know what type of faults they can detect on a machine. It is typically listed in hertz (Hz). The higher the Fmax value, the greater number of faults that a sensor will detect, but it will also allow for earlier indication of potential faults, like a bearing failure. Some ISO standards will reference a Fmax of 1kHz – whilst taking a reading up to 1kHz is suitable for most acceptance testing, it will not highlight even the most basic of bearing faults. A minimum of 2.5kHz Fmax is recommended for good coverage.
Recently, a new sensor has entered the market that boasts a Fmax up to 10kHz. This Fmax gives great coverage for a wide variety of faults, and will accurately inform users of issues on complex equipment like gearboxes that have many higher fault frequencies. In addition, a higher frequency will give an earlier indication of bearing faults. Bearing failures will typically start within the subsurface of the metal with a very small amount of energy being emitted to the sensing element, thus having a sensitive measurement device with the right Fmax is critical to understanding the health of your machine early, prior to failure impacting any processes or causing downtime.
Thank you David Procter with Sensoteq for sharing this educational article with us!
by Diana Pereda
We previously discussed in this series, Do we really need Oil Analysis if We’re Performing other CM Techniques? – Part 2. In this follow-up blog, we will discuss selecting the best CM technique for your equipment.
Part 3 – Selecting the best CM technique for your equipment
We’ve made it to the final installment of this trilogy! Let’s do a quick recap of what we’ve learned thus far. In Part 1, we spoke all about understanding the consistency of oil sampling and determining the criticality of your assets. Next, in Part 2, we really found out more about reading the actual oil analysis report and understanding what the numbers actually mean. We talk about the standard types of tests in addition to some of the specialty tests that can be done for turbines when determining if varnish is present. Let’s take a deeper dive into ways of selecting the best condition monitoring technique for your equipment.
The P-F curve
If you work within the reliability sector or even within maintenance, you will be familiar with the P-F curve. This curve is used to represent the way in which an asset can fail. It can be adapted to any asset but users must acknowledge that not every asset will follow this curve exactly. This curve can be used as a guide to charting the progression of asset failures. According to the ISA (International Society of Automation), the P-F curve demonstrates the technologies used to detect failure from the earliest to the latest as per below:
1. Oil Analysis
2. Ultrasound
3. Vibration
4. Thermography
5. Motor Testing
6. Physical Inspection
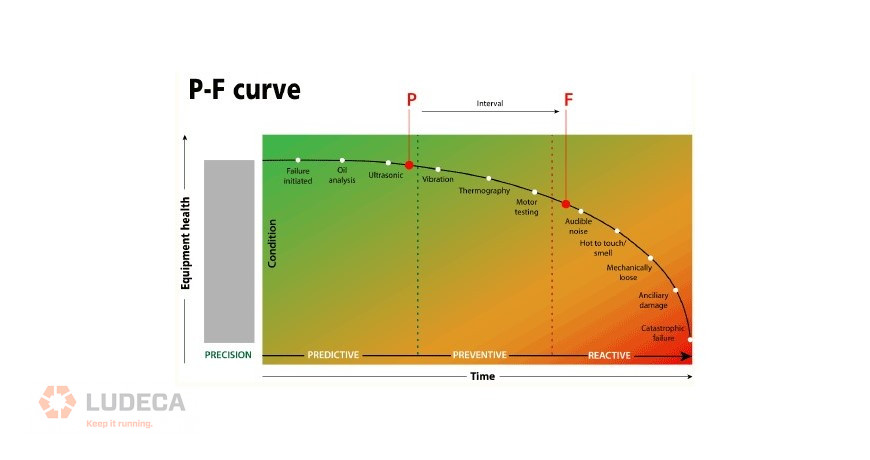
As seen in the figure above, Oil analysis is the first detection point once a failure has been initiated. However, this should not be the only CM technique used as there are quite a number of factors that contribute to the validity of the data from an oil sample.
Other CM techniques
Since we’ve discussed oil analysis at length (in Parts 1 & 2 of this trilogy), we now need to ask the underlying question, “Do we need other CM techniques if Oil Analysis is already being conducted?”. The simple answer is, yes. While oil analysis may be positioned as the first indicator of an abnormality within a system, there are times when oil analysis results can be misrepresented. If a representative sample is not taken, mislabeled, or not shipped off to the lab in time, then the results can be skewed. This can cause users to miss the window of maintenance or perform misguided maintenance leading to the occurring issue not being solved.
As per the P-F curve, there are a few types of technologies that can be employed to detect the onset of an asset failure before it affects its functionality. These are namely, Ultrasonic, Vibration, or Thermography, all of which LUDECA can provide. The key to any successful CM program is firstly establishing its requirements and then modeling the program based on these. If the main requirement is to detect impending failures on critical gearboxes then the CM program should be designed to capture the information, feed this back to the operators and maintenance department in a timely manner and have the issue resolved before its functional failure.
One way of determining complementary technologies is to evaluate the strengths and weaknesses of each type of CM technology. With Oil analysis, we can only detect the presence (or absence) of materials that come into contact with the oil. This will not include other parts of the machine which may not be lubricated. For these parts, perhaps another type of technology can be employed, so the entire asset is monitored, not just the lubricated parts. Additionally, what if there are no lubricated parts? Then, we can’t use oil analysis as a CM technique!
Selecting the best CM technique
When selecting the best CM techniques for your plant, you can look at:
1. Application of the technique across most of the assets – if a technique is being applied, we have to make sure it is scalable. It may not make much sense if we’re only applying the technique to one asset and have to either buy the equipment or get in-house personnel certified to use it. If technicians will be trained in using the technique, then it should be integrated across the assets to bring more value.
2. Integration of these CM techniques into the PM programs – most technicians are not very fond of having another task added to their routine. However, by showing technicians the value that these techniques bring and the possibility of reducing their future workload.
3. Frequency of application – depending on how often the technique will be used, then a decision can be made on whether the company should invest in the actual CM equipment and have in-house personnel trained or if it makes more sense to have a third party perform the inspections. The ROI on the investment into the CM technology should be weighed before making such a decision.
Essentially, while oil analysis is a great predictive method of detecting failures it should be complemented with other CM techniques. This allows us to get the full picture of what is occurring throughout the equipment. Users should select the CM techniques which are best suited for their plant or facility as per their requirements. Ideally, users should consider all of the options before selecting the best-suited CM technique.
Thank you Sanya Mathura with Strategic Reliability Solutions Ltd for sharing this informative and educational article with us!
Related Blog: One Condition Monitoring Technology is Not Enough!
by Diana Pereda
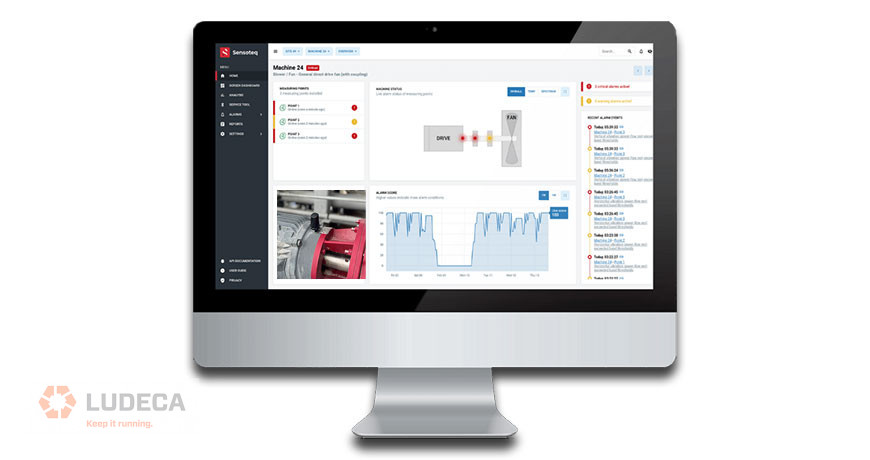
We are thrilled to announce LUDECA and Sensoteq join forces in the US and Caribbean! Sensoteq is a market leader in industrial wireless sensor technology for Condition Monitoring. Together, LUDECA and Sensoteq bring the new, industry-leading Kappa X wireless sensor to the condition monitoring market, together with its cloud-based Analytix software, giving you instant condition monitoring security, all supported by our network of Solutions Providers and technical staff.
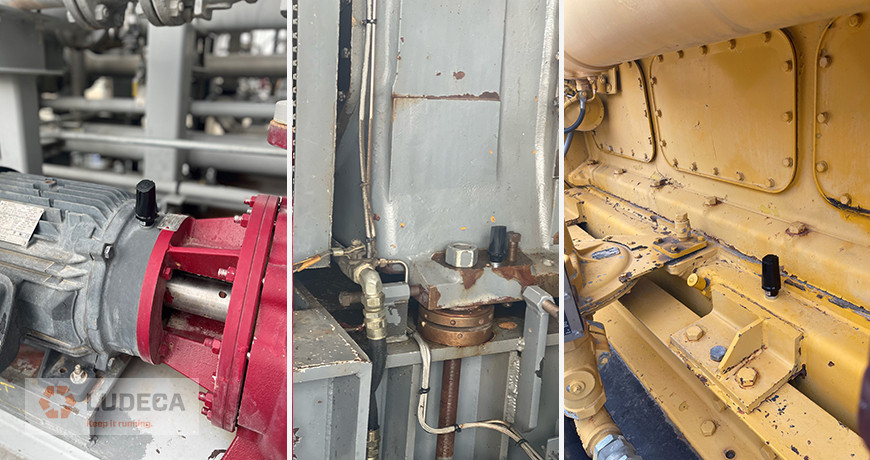
We are delighted to launch our latest product, Kappa X, together with LUDECA in the US and Caribbean. With over 40 years of expertise in the provision of reliability services, LUDECA boasts an invaluable customer service network which teams perfectly with our reliability technology.” —Idir Boudaoud, Sensoteq CEO
At LUDECA, we are always looking for ways to serve our customers better. With the addition of Sensoteq, we bring the world’s finest wireless sensor technology to our customers. Our sales partners and dedicated support team are ready to help you implement this innovative technology.” —Alex Nino, LUDECA Product Manager
Kappa X features all the benefits reliability experts expect from a smart sensor, combining unrivalled wireless technology, a replaceable battery design, and a 10kHz FMax market-leading fault detection capability within a compact 1-inch footprint. It’s quick and easy to install, affordable, and user-configurable so you can mount it on virtually any piece of rotating equipment in any industry.
About LUDECA
LUDECA is a leading provider of Predictive and Proactive Maintenance Solutions including laser alignment, ultrasound testing, vibration analysis, and balancing equipment as well as related software, rentals, services, and training. For more information, visit www.ludeca.com
by Diana Pereda
We previously discussed in this series, Do we really need Oil Analysis if We’re Performing other CM Techniques? – Part 1. In this follow-up blog, we will discuss reading the oil analysis report.
Part 2 – Reading the oil analysis report
An oil analysis report can seem like a lot of numbers and colors all jumbled together for those who may not be familiar with it. The basic element of all reports is that they provide the values seen in your equipment and compare them to those given by the OEM or seen in the field. Some labs provide the reference values while others just stipulate whether they are either within the limits or outside of them. Labs may also provide some advice on courses of action to get help return the oil to normal values.
Oil analysis reports are similar to blood test reports, there are a lot of values and limits but only when we can interpret them properly do they actually make sense. For instance, if the blood report stated that the cholesterol levels were getting into the warning range, we can then adjust our diet and lifestyle to help reduce these. Similarly, with the oil analysis tests, based on the values in the report, we can inspect the machine for evidence of wear or schedule some preventive maintenance accordingly.
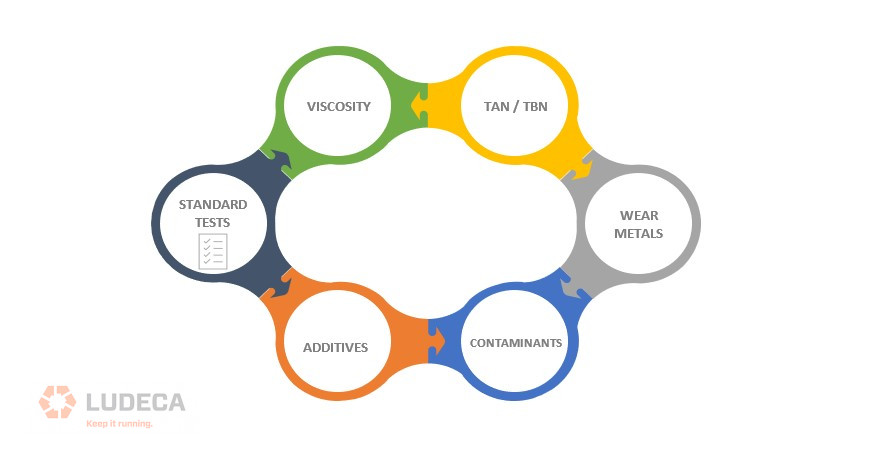
Standard tests within the industry are those which give an overview of the overall health of the oil. Typically, this measure the oil’s viscosity, TBN/TAN, presence of wear metals, contaminants, and additive packages. These properties can guide the user to understand what is happening in their equipment and possibly perform corrective actions before the asset reaches the failure point (on the P-F curve).
The oil’s viscosity is usually measured using the ISO grading system. In this system, the actual viscosity of the oil is placed within a grade. For instance, an oil with a viscosity of 63cSt or 73cSt will be classed as an ISO 68 oil. Thus an ISO 68 grade doesn’t necessarily translate to an oil with a viscosity of 68cSt. With the ISO grades, they have a range of +/-10%. The range for an ISO 68 oil lies between 61.2 CST and 74.8cSt, if it falls out of this range it is no longer classified as an ISO 68 oil. A good reference value for used oil is a change of +/-5% which can determine whether degradation has occurred or not.
The TAN (Total Acid Number) or TBN (Total Base Number) values depict the amount of acid which is being built up in the oil. Engine oils have TBN values while other industrial oils have TAN values. In engine oils, a decrease of approximately 50% of the TBN value is a cause for concern. Any type of acid within your system is not good and a decrease of the TBN by 50% means that the acid level has increased by the same amount. On the other hand, an increase of 0.2 mgKOH/g is a cause for concern in other oils.
The presence of wear metals indicates that there is some form of wear occurring within the equipment. Depending on the type of wear metal which has been detected, one can pinpoint the source of wear. For instance, if the levels of chromium keep increasing in the oil analysis reports and the asset has chrome rings then the source of wear could be isolated to these rings. Thus during maintenance, they can be inspected for wear. Different OEMs have varying values for their equipment especially based on the environment in which they operate, so the best advice is to follow their guidelines or those of the lab for this equipment.
Contaminants are the bad actors which can cause major problems. Just like a pebble in your shoe, contaminants can cause a lot of misery to the equipment it affects. This is particularly important for hydraulic oils where contamination is a huge challenge especially due to the small clearances in this type of equipment. Most OEMs have guidelines on the amount of tolerable contamination for their equipment.
Additives are sacrificial in that their main purpose is to be depleted. However, when this depletion begins at an accelerated rate, that’s when they may no longer be protecting the oil. This is where most of the issues begin. While Oil manufacturers don’t give out the ratio of the additives in their blends, it is always a wise idea to perform oil analysis on a new oil sample and use this as your reference for all the other samples.
These properties help to determine the health of the oil. Thus, by monitoring them, we can get a better picture of what is happening inside the equipment. Remember, changes in the oil are a reflection of what is occurring within the equipment. For instance, if the TBN value drops drastically by 60% or more within one week of the oil being in the equipment, this can indicate the presence of fuel dilution. If the viscosity has also decreased significantly with the 60% decrease in TBN then a possible cause can be fuel dilution. This is the importance of trending the data along with the various properties so hypotheses can be made and then verified through checks.
While these are just some of the standard tests, specialty tests also exist when we’re trying to determine other factors. For instance, in turbine oils, if the viscosity levels are a bit higher than expected or the additive values have dropped to a concerning level, operators may want to investigate the presence of varnish. Varnish can be detrimental to the equipment as it causes a lot of unplanned downtime. Deposits can stick to the insides of the equipment and insulate heat causing equipment temperatures to rise outside of the operating ranges.
The two main types of test to be done for varnish would include; MPC (Membrane Patch Calorimetry) where the oil is passed through a patch and a value is given based on the patch intensity. This can tell us if there are deposits in the oil or varnish pre-cursors. The next test would be the RULER (Remaining Useful Life Evaluation Routine) test which gives a quantitative value of the remaining antioxidants (both primary and secondary) for the oil. This can tell us if oxidation is present and whether the antioxidants have significantly depleted or not. In part 3 of this series, we will talk a bit more about the other types of condition monitoring techniques as well as the method for selecting the best one for your equipment. Stay tuned!
Thank you Sanya Mathura with Strategic Reliability Solutions Ltd for sharing this informative and educational article with us!
by Diana Pereda
Part 1 – Understanding the consistency of oil Sampling
Oil analysis has been one of the most widely used Condition Monitoring (CM) techniques to observe any changes occurring internally in the equipment. Typically, it is one of the most basic techniques utilized within the industry and is viewed as the first line of defense to detect any abnormalities. However, is there a need for oil analysis if the team employs other CM techniques which can also detect changes within the equipment?
In this trilogy, we will explore these main concepts:
- Understanding the consistency of oil sampling (Part 1)
- Reading the oil analysis report (Part 2)
- Selecting the best CM technique for your equipment (Part 3)
Oil Sampling – Consistency is key!
Let’s think about a turbine system and taking a sample from one of these systems. A gas turbine may be connected to compressors, gearboxes, and other small assets. Thus, if we’re trying to monitor the internal condition of the turbine, we need to ensure that the sample we obtain is representative of the system. As such, it is critical that a sample is taken from a turbulent area (or an area that is not a dead zone). Samples should also be taken upstream of the filters (this ensures that any debris or contaminants are not filtered out and can be examined) and downstream of components.
If we are sampling from a closed-loop system, we need to remember to label the sampling points and ensure that the samples are taken with consistency. Data trending is one of the main aspects of oil analysis. When reading oil analysis reports, it is usually compared to the last report/s to determine if there was any progression of contaminants, wear metals, or even additive packages. Thus, if someone samples upstream of the filter and component for one sample but then samples downstream of the filter and component for the follow-up sample, there can be a big difference in the results leading to misconceptions about the condition of the equipment.
How often do you sample?
While consistent sampling is important, determining the frequency of sampling is also critical. There are a couple of factors to consider when calculating this frequency of sampling, namely;
- Aim of the program
- Criticality of the asset
- Type of test/oil
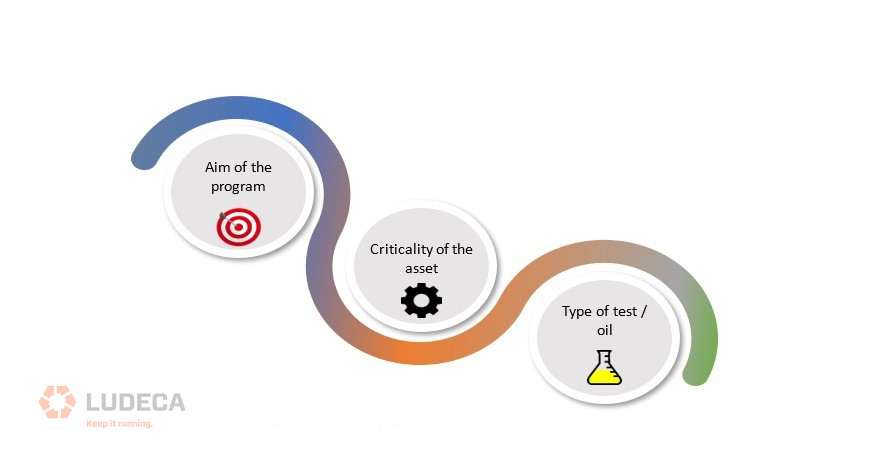
The most important factor to consider is the aim of the test. What are we trying to establish, trend, or prevent? When we fully understand this, then this provides us with the purpose of the oil analysis program. This allows us to then tailor a program suited for the assets within our plant or facility and to determine whether continuous monitoring is needed or if sampling should be done at a specified frequency.
Criticality of your assets
The criticality of the asset helps us to determine the frequency of sampling and the types of tests that need to be carried out. Assets can be classified into critical, semi-critical, and non-critical. Critical assets are those which can cause a significant impact on the plant or facility. The type of impact can vary depending on the factors which are important to the plant. Some plants may hold production as an important factor while others may hold the availability of their equipment for service as their important factor, others can hold both or many others. Sometimes, these can also be tied to the KPIs (Key Performance Indicators) of the plant.
For critical assets, samples should be taken monthly or even bi-weekly depending on what the user is trying to find out. Let’s take a gas turbine as an example. At start-up, if we wanted to monitor the rate of antioxidant depletion or the rate of degradation of the oil, we could test the sample on a bi-weekly schedule for the first two months and then move the sampling to a monthly, quarterly, or even semi-annual schedule once it goes into operation. This is also dependent on the results we get from the sample.
Semi-critical assets are those which do not significantly impact the plant. For instance, if these go down, the plant can still function but at a lower capacity. This does not mean that they are of lesser importance. It simply suggests that the frequency of sampling for these semi-critical assets would not be the same as for critical assets. On the other hand, the non-critical assets are those which do not impact the plant if they shut down. Typically, these are the secondary pumps or equipment. These assets will have a lower sampling frequency than the semi-critical assets. The criticality of the asset should be assessed before determining the frequency of testing.
The types of tests also have a role in determining the sampling frequency as there are some tests that require 24-48 hours to be processed before a result is given. Typically, these tests are slightly more expensive and designed to measure specific properties which may not degrade at a very rapid rate. These specialty tests are usually done quarterly, semi-annually, or even annually such as RPVOT, RULER, and MPC. They also require a larger volume of oil samples which makes it difficult to obtain from those smaller equipment sumps.
When determining the oil sampling frequency, a matrix can be used to help rank assets as per criticality. These assets can also be classified according to the type of oil test they require and if any specialty tests may be needed. Determining the frequency of sampling is just one aspect of having a successful oil analysis program. The next factor is actually reading the results and making maintenance recommendations for the assets. Stay tuned for part 2 when we take a deeper dive into reading the oil analysis report.
Thank you Sanya Mathura with Strategic Reliability Solutions Ltd for sharing this informative and educational article with us!
Related Blog: Equipment Criticality Ranking Tip
by Diana Pereda

Disclaimer: The author is not trying to present himself as an authority on all available CM standards. This blog post is simply an attempt to help those who may be unaware that such guidance exists or of the extent of such standards.
We previously discussed a series of international standards pertaining to condition monitoring of industrial equipment with vibration analysis in, Condition Monitoring & Vibration Classification Standards Awareness: Part 8 20816-9:2020This blog is number 9 in a series of blogs describing some international standards as a help to our Ludeca partners. This blog is about the xx816 standard that concerns itself with industrial wind turbines. The standard described in this blog regards collecting and classifying the vibration of horizontal axis wind turbines with a mechanical gearbox and a rated output exceeding 200kw. See the scope quoted below for the complete description of covered machines. The ISO 10816-21 standard is formatted with the evaluation zones of A to D, just like the other 10816 & 20816 standards, but only offers guidance for the zone boundaries for onshore machines (found in Annex A).
Both acceleration and velocity band quantities are assessed by this standard with many more averages than most of the greater population of industrial equipment; averages overtime of 10 minutes being typical to classify the vibration of the nacelle and tower. Less is needed for the gearbox and generator. The lowest band required by this standard begins at 6cpm (0.1hZ) for the tower, nacelle, and gearbox, while the band with the highest cutoff (5kHz or 300kcpm) is required on the generator.
This standard does provide some acceptance testing guidance. As with most of the other standards in the general xx816 family, “-21” gives guidance for some general condition assessment, but does not attempt to provide diagnostic guidance.
This standard is titled:
ISO 10816-21:2015
Mechanical vibration — Evaluation of machine vibration by measurements on non-rotating parts
Part 21: Horizontal axis wind turbines with gearbox
The scope of this standard is quoted below from the ISO.org preview page (quotation in bold):
Scope:
This part of ISO 10816 specifies the measurement and evaluation of mechanical vibration of wind turbines and their components by taking measurements on non-rotating parts. It applies to horizontal axis wind turbines with mechanical gearbox and rated generator output exceeding 200 kW and the following design and operational characteristics:
- installation on supporting systems (tower and foundation) made of steel and/or concrete;
- horizontal axis rotor with several rotor blades;
- rotor bearing separate from or integrated into the gearbox;
- generators are driven via gearbox;
- generators of the synchronous or asynchronous type (mostly equipped with 4-pole generator);
- generators with only a fixed pole number or which are pole-changeable for speed adjustment;
- output control by rotor blades (pitch or stall wind turbines);
- generator coupled to the power grid via converter or directly.
This part of ISO 10816 recommends zones for evaluating the vibration at continuous load operation. However, in most cases, these evaluation zone boundaries might not be suitable for the early detection of faults. This part of ISO 10816 does not specify vibration values for the zone boundaries because there are insufficient data available for the complete range of wind turbines in the worldwide fleet covered by this part of ISO 10816. However, for information only, Annex A presents evaluation zone boundaries for onshore wind turbines. These zone boundaries are based on vibration data from about 1 000 wind turbines with rated generator output up to 3 MW. They can be helpful in facilitating discussion between users and manufacturers. Evaluation zone boundaries for offshore wind turbines are not yet available.
Although the type and implementation of broad-band vibration monitoring for wind turbines is addressed, this part of ISO 10816 does not apply to diagnostics or fault detection by condition monitoring of wind turbines.
NOTE 1 Information on condition monitoring and diagnostics of wind turbines will be given in ISO 16079 (all parts)1.
The evaluation of the balance quality of the slowly turning wind turbine rotor, which requires special measurements and analysis, is not covered by this part of ISO 10816.
This part of ISO 10816 does not apply to the evaluation of torsional vibration in the drive train. Although coupled lateral and torsional vibration of the tower and drive train can affect the amplitudes of the defined vibration characteristics, diagnosis of this kind of vibration source is not feasible by the described measurement methods described in this part of ISO 10816. For general design verification purposes and for specific fault diagnosis, special measurements are required which are beyond the scope of this part of ISO 10816.
NOTE 2 IEC/TS 61400–13 describes load measurement by use of strain gauges on the supporting structure and blades. Techniques to assist the detection of rolling element bearing and gearbox defects can be found in ISO 13373-2. Measurement and evaluation of structure-borne noise with rolling element bearings are given in VDI 3832.
This part of ISO 10816 does not also apply to acceptance measurements on gearboxes and generators in the manufacturer’s test facility.
NOTE 3 These are assessed on the basis of appropriate standards namely ISO 8579-2 and IEC 60034–14.
To read the ISO’s preview of this standard, click here.
This concludes our series of planned standards blog posts. Requests for further informational blogs on standards will be considered. Thank you for your attention.
by Diana Pereda

