
Disclaimer: The author is not trying to present himself as an authority on all available CM standards. This blog post is simply an attempt to help those who may be unaware that such guidance exists or of the extent of such standards.
We previously discussed a series of international standards pertaining to condition monitoring of industrial equipment with vibration analysis in, Condition Monitoring & Vibration Classification Standards Awareness: Part 8 20816-9:2020This blog is number 9 in a series of blogs describing some international standards as a help to our Ludeca partners. This blog is about the xx816 standard that concerns itself with industrial wind turbines. The standard described in this blog regards collecting and classifying the vibration of horizontal axis wind turbines with a mechanical gearbox and a rated output exceeding 200kw. See the scope quoted below for the complete description of covered machines. The ISO 10816-21 standard is formatted with the evaluation zones of A to D, just like the other 10816 & 20816 standards, but only offers guidance for the zone boundaries for onshore machines (found in Annex A).
Both acceleration and velocity band quantities are assessed by this standard with many more averages than most of the greater population of industrial equipment; averages overtime of 10 minutes being typical to classify the vibration of the nacelle and tower. Less is needed for the gearbox and generator. The lowest band required by this standard begins at 6cpm (0.1hZ) for the tower, nacelle, and gearbox, while the band with the highest cutoff (5kHz or 300kcpm) is required on the generator.
This standard does provide some acceptance testing guidance. As with most of the other standards in the general xx816 family, “-21” gives guidance for some general condition assessment, but does not attempt to provide diagnostic guidance.
This standard is titled:
ISO 10816-21:2015
Mechanical vibration — Evaluation of machine vibration by measurements on non-rotating parts
Part 21: Horizontal axis wind turbines with gearbox
The scope of this standard is quoted below from the ISO.org preview page (quotation in bold):
Scope:
This part of ISO 10816 specifies the measurement and evaluation of mechanical vibration of wind turbines and their components by taking measurements on non-rotating parts. It applies to horizontal axis wind turbines with mechanical gearbox and rated generator output exceeding 200 kW and the following design and operational characteristics:
- installation on supporting systems (tower and foundation) made of steel and/or concrete;
- horizontal axis rotor with several rotor blades;
- rotor bearing separate from or integrated into the gearbox;
- generators are driven via gearbox;
- generators of the synchronous or asynchronous type (mostly equipped with 4-pole generator);
- generators with only a fixed pole number or which are pole-changeable for speed adjustment;
- output control by rotor blades (pitch or stall wind turbines);
- generator coupled to the power grid via converter or directly.
This part of ISO 10816 recommends zones for evaluating the vibration at continuous load operation. However, in most cases, these evaluation zone boundaries might not be suitable for the early detection of faults. This part of ISO 10816 does not specify vibration values for the zone boundaries because there are insufficient data available for the complete range of wind turbines in the worldwide fleet covered by this part of ISO 10816. However, for information only, Annex A presents evaluation zone boundaries for onshore wind turbines. These zone boundaries are based on vibration data from about 1 000 wind turbines with rated generator output up to 3 MW. They can be helpful in facilitating discussion between users and manufacturers. Evaluation zone boundaries for offshore wind turbines are not yet available.
Although the type and implementation of broad-band vibration monitoring for wind turbines is addressed, this part of ISO 10816 does not apply to diagnostics or fault detection by condition monitoring of wind turbines.
NOTE 1 Information on condition monitoring and diagnostics of wind turbines will be given in ISO 16079 (all parts)1.
The evaluation of the balance quality of the slowly turning wind turbine rotor, which requires special measurements and analysis, is not covered by this part of ISO 10816.
This part of ISO 10816 does not apply to the evaluation of torsional vibration in the drive train. Although coupled lateral and torsional vibration of the tower and drive train can affect the amplitudes of the defined vibration characteristics, diagnosis of this kind of vibration source is not feasible by the described measurement methods described in this part of ISO 10816. For general design verification purposes and for specific fault diagnosis, special measurements are required which are beyond the scope of this part of ISO 10816.
NOTE 2 IEC/TS 61400–13 describes load measurement by use of strain gauges on the supporting structure and blades. Techniques to assist the detection of rolling element bearing and gearbox defects can be found in ISO 13373-2. Measurement and evaluation of structure-borne noise with rolling element bearings are given in VDI 3832.
This part of ISO 10816 does not also apply to acceptance measurements on gearboxes and generators in the manufacturer’s test facility.
NOTE 3 These are assessed on the basis of appropriate standards namely ISO 8579-2 and IEC 60034–14.
To read the ISO’s preview of this standard, click here.
This concludes our series of planned standards blog posts. Requests for further informational blogs on standards will be considered. Thank you for your attention.
by Diana Pereda

Disclaimer: The author is not trying to present himself as an authority on all available CM standards. This blog post is simply an attempt to help those who may be unaware that such guidance exists or of the extent of such standards.
We previously discussed a series of international standards pertaining to condition monitoring of industrial equipment with vibration analysis in, Condition Monitoring & Vibration Classification Standards Awareness: Part 7 ISO 20816-8:2018. This is number 8 in a series of blogs describing some international standards as a help to our Ludeca partners. This blog is about what we believe to be the newest addition to the xx816 standard family.
The standard described in this blog concerns itself with collecting and classifying the vibration of gear units sized from about 13HP to 134,000HP. The ISO 20816-9 standard is formatted with the evaluation zones of A to D, just as the other 10816 & 20816 standards. It also provides acceptance testing guidance. Like most of the other standards in the general xx816 family, “-9” provides guidance for general condition assessment, but does not attempt to guide the user through mode determination or supplant narrow band analysis.
This is the first edition of a “-9” or gearset-focused standard in the xx816 family, but it is a technical revision of the ISO 8579-2:1993 standard. ISO 8579-2:1993 was withdrawn in 2016.
This standard is titled:
ISO 20816-9:2020
Mechanical vibration — Measurement and evaluation of machine vibration
Part 9: Gear units
The scope of this standard is quoted below from the ISO.org preview page (quotation in bold):
Scope:
This document specifies requirements for determining and classifying mechanical vibration of individually housed, enclosed, speed increasing or speed reducing gear units. It specifies methods for measuring housing and shaft vibrations, and the types of instrumentation, measurement methods, and testing procedures for determining vibration magnitudes. Vibration grades for acceptance are included.
Torsional vibration measurements are outside the scope of this document.
It applies to a gear unit operating within its design speed, load, temperature range and lubrication for acceptance testing at the manufacturer’s facility. By agreement between manufacturer and customer and/or operator, it can be used for guidelines for on-site acceptance testing and for routine operational measurements.
This document applies to gear units of nominal power rating from 10 kW to 100 MW and nominal rotational speeds between 30 r/min and 12 000 r/min (0,5 Hz to 200 Hz).
This document does not apply to special or auxiliary drive trains, such as integrated gear-driven compressors, pumps, turbines, etc., or gear type clutches used on combined-cycle turbo generators and power take-off gears.
The evaluation criteria provided in this document can be applied to the vibration of the main input and output bearings of the gearbox and to the vibration of internal shaft bearings. They can have limited application to the evaluation of the condition of those gears. Specialist techniques for evaluating the condition of gears are outside the scope of this document.
This document establishes provisions under normal steady-state operating conditions for evaluating the severity of the following in-situ broad-band vibration:
- structural vibration at all main bearing housings or pedestals measured radially (i.e. transverse) to the shaft axis;
- structural vibration at the thrust bearing housings measured in the axial direction;
- vibration of rotating shafts radially (i.e. transverse) to the shaft axis at, or close to, the main bearings;
- structural vibration on the gear casing.
NOTE Vibration occurring during non-steady-state conditions (when transient changes are taking place), including run up or run down, initial loading, and load changes are outside the scope of this document.
To read the ISO’s preview of this standard, click here.
by Diana Pereda

Disclaimer: The author is not trying to present himself as an authority on all available CM standards. This blog post is simply an attempt to help those who may be unaware that such guidance exists or of the extent of such standards.
We previously discussed a series of international standards pertaining to condition monitoring of industrial equipment with vibration analysis in, Condition Monitoring & Vibration Classification Standards Awareness: Part 6 ISO 10816-7:2009This is number 7 in a series of blogs describing a certain family of international standards. The current standard described in this blog is concerned with classifying the vibration of compressors mounted on rigid foundations. The scope (quoted below) is perhaps even more narrow than that of most of the others, and does not offer itself as a condition monitoring tool, but appears to be aimed at helping to identify and avoid fatigue risk for the machine and its related environment.
This standard is titled:
ISO 20816-8:2018
Mechanical vibration — Measurement and evaluation of machine vibration
Part 8: Reciprocating Compressor Systems
The scope of this standard is quoted below from the ISO.org preview page (quotation in bold):
Scope:
This document establishes procedures and guidelines for the measurement and classification of mechanical vibration of reciprocating compressor systems. The vibration values are defined primarily to classify the vibration of the compressor system and to avoid fatigue problems with parts in the reciprocating compressor system, i.e. foundation, compressor, dampers, piping and auxiliary equipment mounted on the compressor system. Shaft vibration is not considered.
This document applies to reciprocating compressors mounted on rigid foundations with typical rotational speed ratings in the range 120 r/min up to and including 1 800 r/min. The general evaluation criteria which are presented relate to operational measurements. The criteria are also used to ensure that machine vibration does not adversely affect the equipment directly mounted on the machine, e.g. pulsation dampers and the pipe system.
NOTE The general guidelines presented in this document can also be applied to reciprocating compressors outside the specified speed range but different evaluation criteria might be appropriate in this case.
The machinery driving the reciprocating compressor, however, is evaluated in accordance with the appropriate part of ISO 10816, ISO 20816 or other relevant standards and classification for the intended duty. Drivers are not included in this document.
It is recognized that the evaluation criteria might only have limited application when considering the effects of internal machine components, e.g. problems associated with valves, pistons and piston rings might be unlikely to be detected in the measurements. Identification of such problems can require investigative diagnostic techniques which are outside the scope of this document.
Examples of reciprocating compressor systems covered by this document are
- horizontal, vertical, V-, W- and L-type compressor systems,
- constant and variable speed compressors,
- compressors driven by electric motors, gas and diesel engines, steam turbines, with or without a gearbox, flexible or rigid coupling, and
- dry running and lubricated reciprocating compressors.
This document does not apply to hyper compressors. The guidelines are not intended for condition monitoring purposes. Noise is also outside the scope of this document
To read the ISO’s preview of this standard, click here.
by Diana Pereda

Disclaimer: The author is not trying to present himself as an authority on all available CM standards. This blog post is simply an attempt to help those who may be unaware that such guidance exists or of the extent of such standards.
We previously discussed a series of international standards pertaining to condition monitoring of industrial equipment with vibration analysis in, Condition Monitoring & Vibration Classification Standards Awareness: Part 5 ISO 20816-5:2018 This is number 6 in a series of blogs describing a certain family of international standards mainly intended to help determine general machine condition, primarily from machine casing vibration levels (with a few exceptions where shaft vibration is also considered).
The standard focused on in this blog concerns itself with characterizing the condition of rotodynamic pumps starting at just above 1 horsepower. Read the scope (quoted below) carefully, as with all the standards. This standard has application to both acceptance testing and in-service condition monitoring.
This standard, unlike the dash 3 (-3) standard, suggests alarm limits without regard to where the machine is operating in relation to a critical speed. It does, however, class pumps into criticality groups, in order to give users flexibility with their alarm sets.
This standard is titled:
ISO 10816-7:2009
Mechanical vibration — Evaluation of machine vibration by measurements on non-rotating parts
Part 7: Rotodynamic pumps for industrial applications, including measurements on rotating shafts
The scope of this standard is quoted below from the ISO.org preview page (quotation in bold):
Scope:
This part of ISO 10816 gives instructions for the evaluation of vibration on rotodynamic pumps for industrial applications with nominal power above 1 kW. It defines the special requirements for the evaluation of vibration when the vibration measurements are made on non-rotating parts (bearing housing vibration). It provides specific guidance for assessing the severity of vibration measured on bearing housings of rotodynamic pumps in situ and for the acceptance test at the manufacturer’s test facility or in the plant. This part of ISO 10816 also gives general information and guidelines for assessing the relative shaft vibration of the rotating shaft.
This part of ISO 10816 specifies zones and limits for the vibration of horizontal and vertical pumps irrespective of their support flexibility. The general evaluation criteria are valid for operational monitoring of rotodynamic pumps and for acceptance tests1) in situ or at the manufacturer’s test facility if specified. For the acceptance test at the manufacturer’s test facility, special conditions are given.
For monitoring the vibration values during long-term operation, two criteria are provided for assessing the machine vibration. One criterion considers the magnitude of the observed vibration and the second considers changes in magnitude. The evaluation criteria are applicable for the vibration produced by the pump itself and not for vibration which is transmitted to the pump from external sources. The criteria mainly serve to ensure a reliable, safe long-term operation of the pump, simultaneously minimizing harmful effects on connected devices. Additionally, recommendations are given for defining operational limits and setting alarm and trip values.
For pump units with integrated electrical motors (impeller directly on the motor shaft or impeller shaft rigidly connected to the motor shaft), this part of ISO 10816 applies to the whole coupled unit.
For flexibly coupled motors, this part of ISO 10816 is applicable for the pump only. Also, separately mounted drivers are not within the scope of this part of ISO 10816. Those drivers are dealt with in ISO 10816-3.
The following types of pumps are excluded from this part of ISO 10816:
- reciprocating and rotating positive displacement pumps;
- reciprocating engine driven pumps;
- pumps in hydraulic power generating and pumping plants with power above 1 MW (see ISO 7919-5[4] and ISO 10816-5);
- solids handling, slurry, and submersible pumps.
Torsional vibration is not dealt with in this part of ISO 10816.
To read the ISO’s preview of this standard, click here.
by Diana Pereda

Disclaimer: The author is not trying to present himself as an authority on all available CM standards. This blog post is simply an attempt to help those who may be unaware that such guidance exists or of the extent of such standards.
We previously discussed a series of international standards pertaining to condition monitoring of industrial equipment with vibration analysis in, Condition Monitoring & Vibration Classification Standards Awareness: Part 4 ISO 10816-4:2018 Next in the series of international standards, developed for the purpose of having a sound foundation to establish the general condition of industrial equipment via the overall vibration and in some instances including a measure of rotational frequency vibration or frequencies specific to the equipment type (i.e. vane passing frequency vibration), is ISO 20816-5.
This standard is titled:
ISO 20816-5:2018
Mechanical vibration — Measurement and evaluation of machine vibration
Part 5: Machine sets in hydraulic power generating and pump-storage plants
The scope of this standard is quoted below from the ISO.org preview page (quotation in bold):
Scope:
This document provides guidelines for evaluating the vibration measurements made at the bearings, bearing pedestals, or bearing housings and also for evaluating relative shaft vibration measurements made on machine sets in hydraulic power generating and pump-storage plants when the machine is operating within its normal operating range. The normal operating ranges for each type of turbine covered by this document are defined in Annex A.
This document is applicable to machine sets in hydraulic power generating plants and in pump-storage plants with typical rotational speeds of 60 r/min to 1 000 r/min fitted with shell or pad (shoe) type oil-lubricated bearings.
NOTE The current database includes machine speeds ranging from 60 r/min to 750 r/min (with a very small sample of 1 000 r/min machines).
This document defines different limit values of bearing housing and shaft vibration depending on the type of turbine, the orientation of the shaft (i.e. horizontal or vertical), and for each of the bearing locations.
This document is based on statistical analysis and provides criteria for the most common types of turbines, pump-turbines, and pumps. For specific information on which types of units are covered in this document, see Annex A.
Machine sets covered by this document can have the following configurations:
- generators driven by hydraulic turbines;
- motor-generators driven by pump-turbines;
- motor-generators driven by hydraulic turbines and separate pumps;
- pumps driven by electric motors.
This document is not applicable to the following unit configurations, parameters, and operating conditions:
- hydraulic machines with water-lubricated bearings;
- hydraulic machines or machine sets having rolling element bearings (for these machines, see IEC 62006 and/or ISO 10816-3);
- pumps in thermal power plants or industrial installations (for these machines, see ISO 10816-7);
- electrical machines operating as motors except for the use of these machines in pump-storage applications;
- hydro generators operating as synchronous condensers (with the water in the turbine depressed by compressed air);
- assessment of absolute bearing housing vibration displacement;
- assessment of axial vibration;
- assessment of transient conditions;
- non-synchronous operation;
- assessment of vibration of the generator stator core or the stator frame level.
Measurements made of the bearing housing vibration and shaft vibration occurring in machine sets in hydraulic power generating and pump-storage plants can be used for the following purposes:
- Purpose A: to prevent damage arising from excessive vibration magnitudes;
- Purpose B: to monitor changes in vibrational behavior in order to allow diagnosis and/or prognosis.
The criteria are applicable for the vibration produced by the machine set itself. A special investigation is needed for vibration transmitted to the machine set from external sources, e.g. transmitted to the machine via the station foundations.
Once again, as in the previous standard, this standard is quite specific.
To read the ISO’s preview of this standard, click here.
by Diana Pereda

Disclaimer: The author is not trying to present himself as an authority on all available CM standards. This blog post is simply an attempt to help those who may be unaware that such guidance exists or of the extent of such standards.
We previously discussed a series of international standards pertaining to condition monitoring of industrial equipment with vibration analysis in, Condition Monitoring & Vibration Classification Standards Awareness: Part 3 ISO 10816-3. Next in the series of international standards developed for the purpose of having a groundwork to establish the general condition of industrial equipment via the overall vibration and in some instances including a measure of rotational frequency vibration or frequencies specific to the equipment type (i.e., vane passing frequency vibration) which is ISO 20816-4.
This standard is titled:
ISO 20816-4:2018
Mechanical vibration — Measurement and evaluation of machine vibration
Part 4: Gas turbines in excess of 3 MW, with fluid-film bearings
The scope of this standard is quoted below from the ISO.org preview page (quotation in bold):
This document is applicable to land-based gas turbines with fluid-film bearings and power outputs greater than 3 MW and an operating speed under load between 3 000 r/min and 30 000 r/min. In some cases (see the list of exclusions below), this includes other rotating machinery coupled either directly or through a gearbox. The evaluation criteria provided in this document are applicable to the vibration of the main input and output bearings of the gearbox but are not applicable to the vibration of the internal gearbox bearings nor to the assessment of the condition of those gears. Specialist techniques required for evaluating the condition of gears are outside the scope of this document.
This document is not applicable to the following:
- gas turbines with power outputs greater than 40 MW at rated speeds of 1 500 r/min, 1 800 r/min, 3 000 r/min or 3 600 r/min (see ISO 20816-2);
- aero-derivative gas turbines (including gas turbines with dynamic properties similar to those of aero-derivatives);
NOTE ISO 3977-3 defines aero-derivatives as aircraft propulsion gas generators adapted to drive mechanical, electrical or marine propulsion equipment. Large differences exist between heavy-duty and aero-derivative gas turbines, for example, in casing flexibility, bearing design, rotor-to-stator mass ratio and mounting structure. Different criteria, therefore, apply for these two turbine types.
- gas turbines with outputs less than or equal to 3 MW (see ISO 7919-3 and ISO 10816-3);
- turbine driven generators (see ISO 20816-2, ISO 7919-3and ISO 10816-3);
- turbine driven pumps (see ISO 10816-7);
- turbine driven rotary compressors (see ISO 7919-3and ISO 10816-3);
- the evaluation of gearbox vibration (see this clause) but does not preclude monitoring of gearbox vibration;
- the evaluation of combustion vibration but does not preclude monitoring of combustion vibration;
- rolling element bearing vibration.
This document establishes provisions for evaluating the severity of the following in-situ broad-band vibrations:
- structural vibration at all main bearing housings or pedestals measured radial (i.e. transverse) to the shaft axis;
- structural vibration at thrust bearing housings measured in the axial direction;
- vibration of rotating shafts radial (i.e. transverse) to the shaft axis at, or close to, the main bearings.
These are in terms of the following:
- vibration under normal steady-state operating conditions;
- vibration during other (non-steady-state) conditions when transient changes are taking place, including run up or run down, initial loading and load changes;
- changes in vibration which can occur during normal steady-state operation.
As you can see from the “Scope” declaration, this standard is quite specific and likely is a “must have” for those who are monitoring gas turbines within the scope of the standard.
To read the ISO’s preview of this standard, click here.
by Diana Pereda
Disclaimer: The author is not trying to present himself as an authority on all available CM standards. This blog post is simply an attempt to help those who may be unaware that such guidance exists or of the extent of such standards.
We previously introduced a series of international standards pertaining to condition monitoring of industrial equipment with vibration analysis in, This series ends with the numeric sequence of xx816-x. The original standards from 1974 (ISO 2372) and 1985 (ISO 3945) were replaced or superseded by ISO 10816-1 in 1995. 10816-1 was amended in 2009 and then replaced by ISO 20816-1 in 2016. Next (numerically) is the standard we also mentioned in our previous blog, 20816-2. The dash 2 standard covers the measurement and evaluation of vibration on large land-based gas or steam turbines and generators.
The subsequent standard in the series, the “dash 3” standard is the focus of this blog. This standard is titled:
INTERNATIONAL STANDARD ISO 10816-3
Mechanical vibration — Evaluation of machine vibration by measurements on non-rotating parts
Part 3: Industrial machines with nominal power above 15 kW and nominal speeds between 120 r/min and 15 000 r/min when measured in situ
ISO 10816-3 is the current standard in the series that covers a general range of equipment types and sizes. When first created it was the “catch-all” standard used for many types of machines (such as centrifugal pumps which are now covered by the dash 7 standard) that have since come to be covered by their own specific part of the series. The “10816” issuance of the dash 3 standard is still in force, but to be current it must be joined by a 2017 amendment, “Amendment 1”. This amendment actually modifies the scope of the standard, so it is critical to its being considered current.
The scope of this standard is quoted below from the ISO.org preview page (quotation in bold).
Important Note: The scope shown in the preview cannot be considered current because it is modified by Amendment 1.
Scope:
This part of ISO 10816 gives criteria for assessing vibration levels when measurements are made in situ. The criteria specified apply to machine sets having power above 15 kW and operating speeds between 120 r/min and 15 000 r/min.
The machine sets covered by this part of ISO 10816 include:
- steam turbines with power up to 50 MW
- steam turbine sets with power greater than 50 MW and speeds below 1 500 r/min or above 3 600 r/min (not included in ISO 10816-2)
- rotary compressors
- industrial gas turbines with power up to 3 MW
- generators
- electrical motors of any type
- blowers or fans
NOTE: However, the vibration criteria presented in this part of ISO 10816 are generally only applicable to fans with power ratings greater than 300 kW or fans that are not flexibly supported. As and when circumstances permit, recommendations for other types of fans, including those with lightweight sheet metal construction, will be prepared. Until such time, classifications can be agreed upon between the manufacturer and the customer, using results of previous operational experience, see also ISO 14694[4].
The following are excluded from this part of ISO 10816:
- land-based steam turbine generator sets with power greater than 50 MW and speeds of 1 500 r/min, 1 800 r/min, 3 000 r/min, or 3 600 r/min (see ISO 10816-2)
- gas turbine sets with power greater than 3 MW (see ISO 10816-4)
- machine sets in hydraulic power generating and pumping plants (see ISO 10816-5)
- machines coupled to reciprocating machines (see ISO 10816-6)
- rotodynamic pumps including integrated electric motors, i.e. where the impeller is mounted directly on the motor shaft or is rigidly attached to it (see ISO 10816-7)
- rotary positive displacement compressors (e. g. screw compressors)
- reciprocating compressors
- reciprocating pumps
- submerged motor-pumps
- wind turbines
The criteria of this part of ISO 10816 apply to in situ broad-band vibration measurements taken on the bearings, bearing pedestals, or housing of machines under steady-state operating conditions within the nominal operating speed range. They relate to both acceptance testing and operational monitoring. The evaluation criteria of this part of ISO 10816 are designed to apply to both continuous and non-continuous monitoring situations.
This part of ISO 10816 encompasses machines that may have gears or rolling element bearings but does not address the diagnostic evaluation of the condition of those gears or bearings.
The criteria are applicable only for the vibration produced by the machine set itself and not for vibration which is transmitted to the machine set from external sources.
To read the ISO’s preview of this standard, click here.
by Diana Pereda

Disclaimer: The author is not trying to present himself as an authority on all available CM standards. This blog post is simply an attempt to help those who may be unaware that such guidance exists or of the extent of such standards.
Are you looking for some guidance on a well-designed approach to condition monitoring and/or acceptance criteria for some types or categories of equipment? The International Standards Organization (ISO) has brought together standards groups from around the world and compiled excellent general guidelines for the condition monitoring (and in some cases acceptance testing) of many major groups of machine types.
The U.S. participant in the development of the standards is the American National Standards Institute (ANSI). ANSI itself has hundreds if not thousands of member societies that are well represented on the sub-committees such as the sub-committee “ISO/TC 108/SC 2” which is responsible for the development of the ISO 20816-1 standard. Many of the members of ANSI are quite recognizable to those of us who have been around the industry for some time including ASHRAE, ASME, SAE, ABMA, AGMA, ASNT, AWEA, HI, and API.
If you are interested in standardized guidance to condition monitoring on your equipment, then consider beginning with the standard “ISO 20816-1” which is the compilation of the general vibration monitoring guidelines for numerous other standards, each of which applies to a specific group of equipment types. The current standard was completed in 2016 and is titled:
ISO 20816-1: 2016
Mechanical vibration – Measurement and evaluation of machine vibration
Part 1: General guidelines
The scope of this standard is quoted below from the ISO.org preview page (quotation in bold listed below):
Scope:
This document establishes general conditions and procedures for the measurement and evaluation of vibration using measurements made on rotating, non-rotating and non-reciprocating parts of complete machines. It applies to both absolute and relative radial shaft vibration measurements concerning the monitoring of radial clearances but excludes axial shaft vibration. The general evaluation criteria, presented in terms of both vibration magnitude and change of vibration, relate to both operational monitoring and acceptance testing. They have been provided primarily concerning securing the reliable, safe, long-term operation of the machine while minimizing adverse effects on associated equipment. Guidelines are also presented for setting operational limits.
NOTE 1 The evaluation criteria for different classes of machinery will be included in other parts of ISO 20816 when they become available. In the meantime, guidelines are given in Clause 6.
NOTE 2 The term “shaft vibration” is used throughout ISO 20816 because, in most cases, measurements are made on machine shafts. However, the ISO 20816 series is also applicable to measurements made on other rotating elements if such elements are found to be more suitable, provided that the guidelines are respected.
For the purposes of ISO 20816, operational monitoring is considered to be those vibration measurements made during the normal operation of a machine. The ISO 20816 series permits the use of different measurement quantities and methods, provided that they are well-defined and their limitations are set out so that the interpretation of the measurements is well-understood.
The evaluation criteria relate only to the vibration produced by the machine itself and not the vibration transmitted to it from the outside.
This document does not include consideration of torsional vibration.
To read the ISO’s preview of this standard, click here.
Stay tuned as we will be introducing other standards in this xx816 track in the coming weeks, beginning today with the current part 2, which was completed in 2017:
ISO 20816-2: 2017
Mechanical vibration – Measurement and evaluation of machine vibration
Part 2: Land-based gas turbines, steam turbines, and generators over 40 MW, with fluid-film bearings and rated speeds of 1 500 r/min, 1 800 r/min, 3 000 r/min, and 3 600 r/min
The scope of this standard is quoted below from the ISO.org preview page (quotation in bold listed below):
Scope:
This document applies to land-based gas turbines, steam turbines, and generators (whether coupled with gas and/or steam turbines) with power outputs greater than 40 MW, fluid-film bearings, and rated speeds of 1 500 r/min, 1 800 r/min, 3 000 r/min or 3 600 r/min. The criteria provided in this document can be applied to the vibration of the gas turbine, steam turbine, and generator (including synchronizing clutches). This document establishes provisions for evaluating the severity of the following in-situ, broad-band vibration:
- structural vibration at all main bearing housings or pedestals measured radial (i.e. transverse) to the shaft axis;
- structural vibration at thrust bearing housings measured in the axial direction;
- vibration of rotating shafts radial (i.e. transverse) to the shaft axis at, or close to, the main bearings.
These are in terms of the following:
- vibration under normal steady-state operating conditions;
- vibration during other (non-steady-state) conditions when transient changes are taking place, including run up or run down, initial loading and load changes;
- changes in vibration which can occur during normal steady-state operation.
This document does not apply to the following:
- electromagnetic excited vibration with twice line frequency at the generator stator windings, core, and housing;
- aero-derivative gas turbines (including gas turbines with dynamic properties similar to those of aero-derivatives)
- NOTE ISO 3977-3 defines aero-derivatives as aircraft propulsion gas generators adapted to drive mechanical, electrical, or marine propulsion equipment. Large differences exist between heavy-duty and aero-derivative gas turbines, for example, in casing flexibility, bearing design, rotor-to-stator mass ratio, and mounting structure. Different criteria, therefore, apply for these two turbine types.
- steam turbines and/or generators with outputs less than or equal to 40 MW or with rated speeds other than 1 500 r/min, 1 800 r/min, 3 000 r/min, or 3 600 r/min (although generators seldom fall into this latter category) (see ISO 7919-3 and ISO 10816-3);
- gas turbines with outputs less than or equal to 40 MW or with rated speeds other than 1 500 r/min, 1 800 r/min, 3 000 r/min or 3 600 r/min (see ISO 7919-3or ISO 7919-4and ISO 10816-3 or ISO 10816-4);
- the evaluation of combustion vibration but does not preclude monitoring of combustion vibration.
To read the ISO’s preview of this standard, click here. Check out the standards. If they sound like they may be helpful to you, they can be purchased at numerous places on the web including the ANSI website, ISO store, and/or the one I use, Techstreet store.
An analyst or organization using these standards should be aware that RMS overall velocity from 600cpm to 60kcpm (or 10Hz to 1kHz – the primary quantity used in the standard) does a fairly good job generally gauging the effect of things like unbalance, misalignment, mechanical looseness, resonance involvement, and even some electrical problems characterized by single-digit multiples of the line frequency, but may not give an acceptably early warning for several failure modes and certainly not for bearing defects in many cases. The overall or “unfiltered” measurement is not intended in any way to identify the source or cause of the vibration.
There is an ISO standard that is targeted to provide guidance on diagnosing specific faults (ISO 13373) which will likely be the subject of a future blog post after finishing the series on the xx816 family of standards.
by Diana Pereda
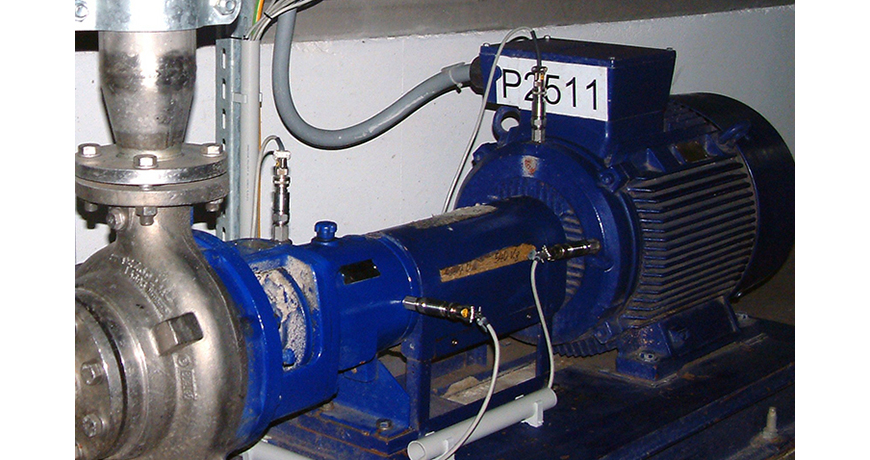
Below is a short list of when someone should consider using permanently mounted vibration sensors. This scenario would involve either epoxying on the vibration sensors or drilling into the equipment to allow for the sensor to be physically attached to the equipment. A vibration cable is then attached to the sensor and terminated into a junction or switch box. The junction or switch box can vary on the number of points that need to be collected. Once the cables are terminated into the junction box the analyst can collect data directly from the junction box.
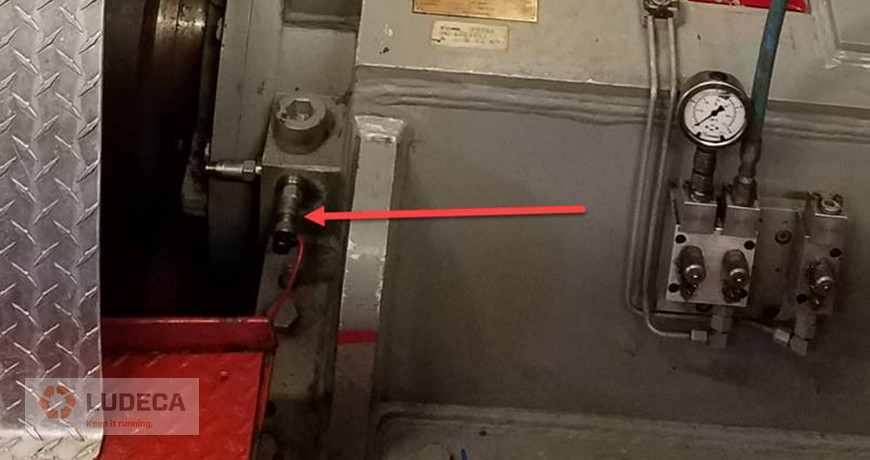
Please note a handheld vibration collector like our VIBWORKS portable vibration data collector, would need to be connected to the junction box to collect vibration data from the permanently mounted sensors.
- Safety – Some equipment can be dangerous to be near
- Saves time – Some equipment can be mounted in hard to reach places
- Avoid hazardous environment – The junction box can be mounted outside the hazardous area
- The first phase of an online deployment – The installation, sensors, and cables are a large cost in any online project. A Cortex online system can be added later to replace the junction box.
Below is a short list of when someone might not consider using permanently mounted vibration sensors. This scenario would involve either epoxying on the vibration sensors or drilling into the equipment to allow for the sensor to be physically attached to the equipment. A vibration cable is then attached to the sensor and terminated into a junction or switch box. The junction or switch box can vary on the number of points that need to be collected. Once the cables are terminated into the junction box the analyst can collect data directly from the junction box.
Please note a handheld vibration collector like our VIBWORKS portable vibration data collector, would need to be connected to the junction box to collect vibration data from the permanently mounted sensors.
- Cost – Multiple sensors and cables can become expensive
- Time – Installation of the sensors, cables, junction boxes, and conduit
- Loss of human interaction – The analyst cannot use their senses (sight, hearing, and touch) as they are not near the machines
- Damaged cables or sensors – Sensors dislocated and cables cut
Do you have any pros or additional cons to using permanently mounted sensors? Do you have any images of junction boxes that are currently in use or comments on why permanently mounted vibration sensors would not function for your applications? Please share those with us!
by Diana Pereda
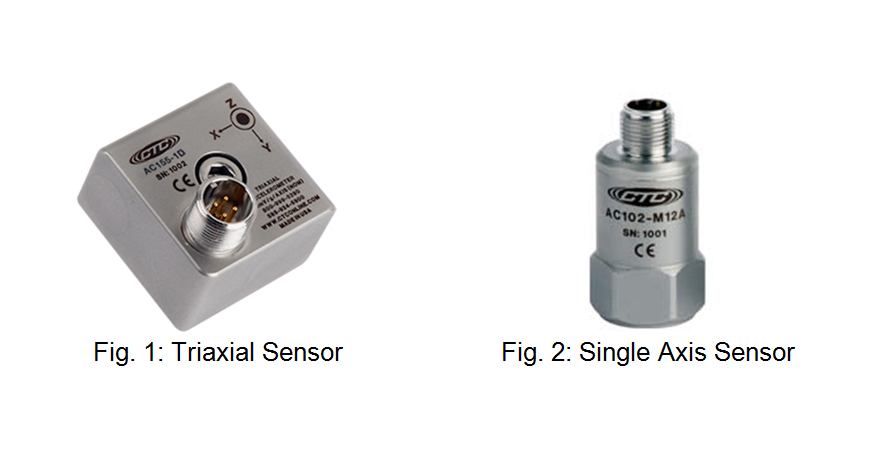
A sensor generally measures 95% of what it’s capable of measuring in line with the sensor. Two common types of vibration sensors are:
-
Single axis accelerometers
-
Triaxial accelerometers
So which one is best for your application?
A single axis sensor simply measures vibration in only one axis, so the sensor can be moved to the direction or axis of interest to be measured. A triaxial sensor has three sensors built into one housing and therefore can measure three axes or directions without having to relocate the sensor, as with a single axis sensor.
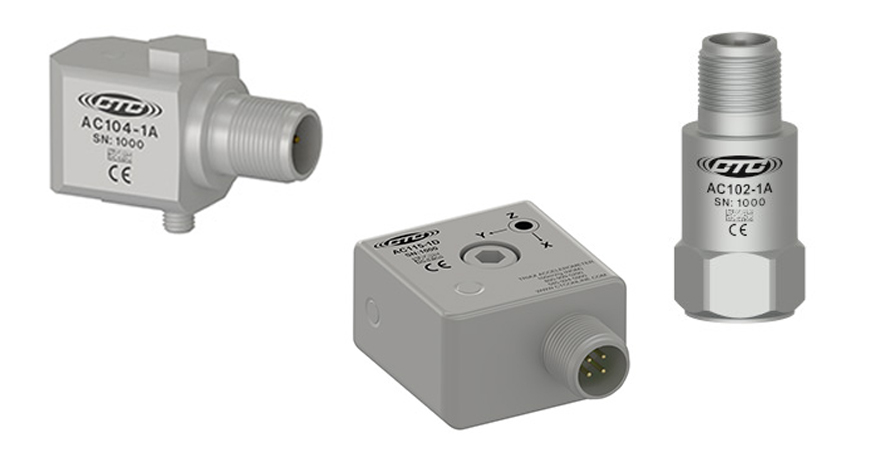
Image Courtesy of Connection Technology Center, Inc. – CTC
All data systems on the market today will use a single axis sensor, however, some are also capable of utilizing a triaxial sensor but not all three channels at once. Some two-channel instruments can use a triaxial sensor but they will only process two axes at one time then take the third axis reading. To collect all three axes simultaneously you need a true three-channel (or greater) analyzer. For example, the VIBWORKS vibration instrument allows for both triax and single axis data collection. The VIBWORKS is a true four-channel instrument. Triaxial data collection can be a time saver when collecting large amounts of data, but as with all things there are pros and cons. Using single axis sensors would typically involve moving the sensor from the horizontal to vertical to axial positions at each bearing to collect the data. Using a triaxial sensor you place the sensor at the bearing and collect all three axes simultaneously. Drawbacks to triaxial sensor are the cost of the sensor and cable; the sensor alone can cost 3× or more the price of a single axis sensor. At some facilities that use a triaxial sensor they simply place the sensor at a single location on a machine and take the three axis readings and move onto the next machine. Only if a problem is detected they return to the machine and take more precision data. The user must make sure the sensor is always orientated and placed the same each time readings are collected as the sensor has three axes X,Y, and Z and if the orientation of the sensor is turned the trend of the machine data becomes skewed or void.
by Diana Pereda
First one must know what the definition of phase is in the reliability world. Phase is simply the relationship between two events. There is absolute phase that is usually measured as either “phase-led”, which is from the peak in a filtered time waveform to the tachometer, or once per revolution indicator, or “phase-lag” which is from the tachometer or once per revolution indicator to the peak in a filtered time waveform. Of the two, phase-lag is probably the most common.
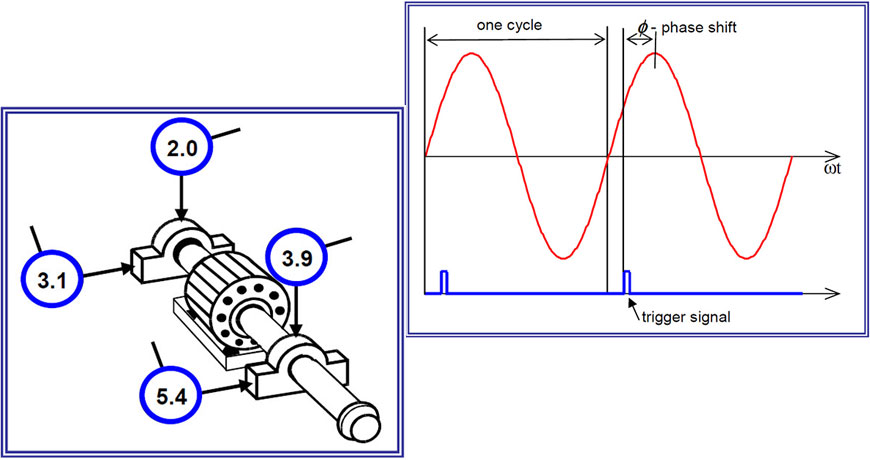
There is also relative phase which takes two filtered time waveforms and compares the phase between the two. Generally your Channel One or A (as the case may be) is stationary and you can move Channel Two or B from position to position and get the indicated phase. Relative phase can be a time saver as the user can get an indicated phase without shutting down the machine to put reflective tape on the shaft for a laser or optical pick-up. This can be used to verify or diagnose unbalance, misalignment, and looseness, etc., but it cannot be used for dynamic balancing which requires absolute phase for repeatable calculations. Whichever type of phase is used, you can use it to identify and/or confirm unbalance; check the phase on each side of the coupling as well as across the coupling to determine misalignment and what type of misalignment. Note: Always remember the orientation of the sensor as motion towards an accelerometer is positive energy in the time waveform and motion away from the accelerometer is negative energy in the time waveform.
The user can place the sensor on each side of a junction where two surfaces come together and look for a phase shift which indicates the two surfaces are not tight to each other. This could be looseness between a motor foot to the base, or from the base to the sole plate, or from the sole plate to the foundation, or even from the foundation to the slab. If everything is tight then the machine will move as one.
Phase can also be used to look for cocked bearings, bent or bowed shafts and other things as well.
Our advanced vibration analyzers, along with phase analysis, can help you better diagnose fault conditions.
Featured Graphics taken from Vibration Diagnostics report by Alena Bilosova and Jan Bilos – Ostrava 2012
by Diana Pereda
First off, “triax” is short for “triaxial accelerometer sensor”. A triaxial sensor has three (tri) separate sensors (that collect data in the X, Y, and Z directions) contained in one housing, compared to a single axis sensor in a normal accelerometer.
There are many pros and cons to using a triaxial sensor. A few things to consider:
- Cost
- Position
- Data frequency
- Time
The triax sensor (Fig. 1) is more expensive than the single axis sensor (Fig. 2). When using the triax sensor, it has to be mounted in the same orientation each time or the directions will not match the data that was collected before. Many places sell triax mounting pads to make certain that the sensor is locked in a certain orientation to ensure correct data collection. This represents an additional cost, and time must also be budgeted to mount the pads. Do not mix sensors when collecting data. If the same motor is having vibration data collected using a triax sensor, then do not collect data another month with a single axis sensor. A single axis sensor will need to be moved three times to the correct orientation for data collection whereas the triax was mounted in just one position. This could affect the trending of your data.
The VIBWORKS vibration instrument allows for both triax and single axis data collection. The VIBWORKS is a true four-channel instrument. This allows the instrument to collect data in all three directions at once. Normally three directions are taken per bearing on equipment. Depending on the setup and the equipment, it could take up to 20 seconds per direction to collect and save the vibration data. On a normal motor-fan machine train this means 12 directions which would take around 4 minutes to collect vibration data on, using a single axis sensor. Using a triax sensor it would only take 80 seconds to collect vibration data on the entire machine train.
When selecting a triax sensor, make certain that the vibration instrument is not multiplexing the vibration channels. For example it the instrument is only capable of two channels it will collect two channels at the same time and then collect the third channel separately. This means it would take almost three minutes to collect data as all three channels are not being collected at the same time.
by Diana Pereda
Where to place the vibration sensor depends on what data you wish to see. Certain defects show up better in the horizontal direction while other defects show up better in the vertical direction. So which location should I choose to place my vibration sensor? Most sensors in use today are single-axis sensors, so generally 95% of what they pick up or detect is in line with the sensor. Therefore, since placement of the sensor is crucial, some thought should be given as to what data shows up best in which of the three directions—vertical, horizontal, and axial. Data taken in the vertical direction will typically show looseness better than in the horizontal direction (at least on a horizontally mounted piece of equipment); however the horizontal will show unbalance better than the vertical. Axial vibration will show angular misalignment better than a radial reading will.
Also, it should be considered that in the real world there are times that the sensor cannot be placed directly on a bearing, such as with the non-drive end bearing on an electric motor due to the fan cover; on large motors this cover can extend 10 in. or more from the bearing, and considering that rolling element bearing generate high frequency data in early stages of failure and high frequency data only travels short distances, the data can and will be diminished the further from the bearing that you take your reading. In these cases you simply get as close as possible to the bearing knowing the generated signal may be diminished; in such case you should pay special attention to the frequencies present as they may be at lower levels than expected. If you are dealing with vertical equipment it’s typically stiffer in-line with the discharge than perpendicular to the discharge and that will affect your data as well.
For more information on a vibration tool to collect and analyze your sensor data, check us out!
by Diana Pereda
When using phase to determine how a machine is moving, the orientation of the sensor mounted on the machine is extremely important. In Figure 1 below one sensor is attached to the motor’s outboard (non-drive) end in one orientation, and on the other inboard (drive) end, it is mounted in the opposite direction.
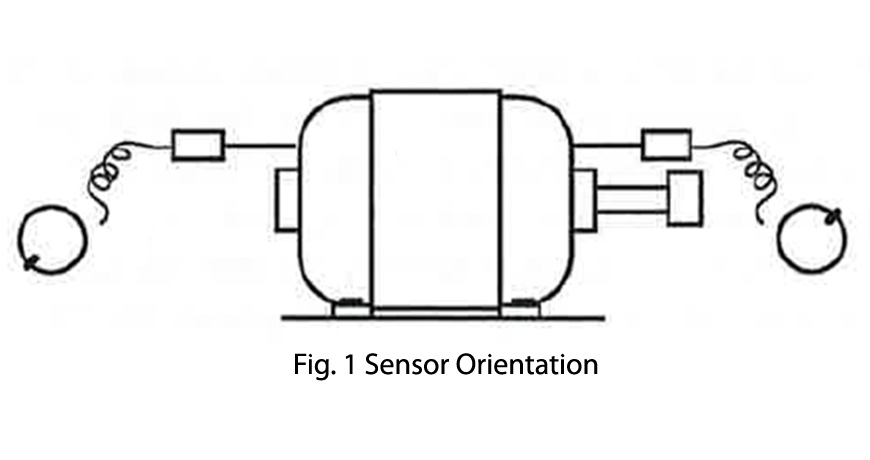
Because the sensors are attached to the motor’s ends opposite one another the resulting phase angles would be 180 degrees opposed to each other. To correct for this, the user has to choose a reference location and then correct the measured phase angle for any sensor locations where the sensor position is opposite the reference.
For measured phase readings of less than 180 degrees the user would add 180 degrees to the measured phase angle and for measured phase angles that are greater than 180 degrees the user would subtract 180 degrees from the measured reading.
In most applications this occurs most often in the axial direction of measurement; however, sometimes due to obstructions, the user cannot physically place the sensor in the same orientation as the reference sensor in the horizontal or vertical axis.
Just as with the axial direction, the user will have to determine a reference location and then correct the measurements for any locations where the sensor position doesn’t match the reference location.
Figure 2 below is what is commonly called a “Bubble Diagram”. The bubble diagram is used to record the vibration amplitude and phase angle at all machine locations in the machine train in the vertical, horizontal and axial directions.
As previously stated, the analyst must determine if any sensor measurement locations will require the sensor to be attached to the machine differently and adjust the phase readings at locations different from the reference accordingly.
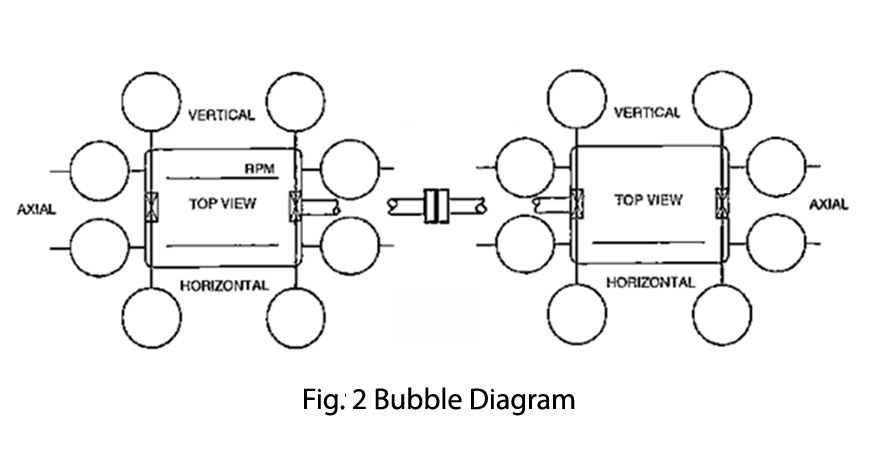
The easiest way to keep track of reference directions and location is to draw a little arrow as shown below in Figures 3 and 4. If the arrow is pointing towards the machine this indicates that the phase angle was recorded directly as indicated.

When the arrow is pointing away from the machine as shown above in Figure 4, the phase angle recorded in the bubble diagram is 180 degrees opposed from what was actually measured.
Source: Practical Solutions to Machinery and Maintenance Vibration Problems by Update International
Our advanced vibration analyzers, along with phase analysis, can help you better diagnose fault conditions.
by Diana Pereda
Guest post by Suzane Greeman, ASQ-CMQ/OE, CAMA, CAMP, CMRP, author of the Risk-based Asset Criticality Assessment (R-b ACA©) Handbook. Suzane is the Principal Asset Management Advisor of Greeman Asset Management Solutions Inc.
Asset Condition Management
Asset failure is the most common form of risk that is managed in industrial plants. One key element of asset risk management is asset condition management. Asset condition is a factor in determining the probability of an asset’s failure. Asset condition is important when developing asset management plans and when prioritizing CapEx and OpEx (TotEx) funds. In fact, a company with a good understanding of how the conditions of critical assets are changing over time has a good line of sight to emerging risks and what it will cost to treat them.
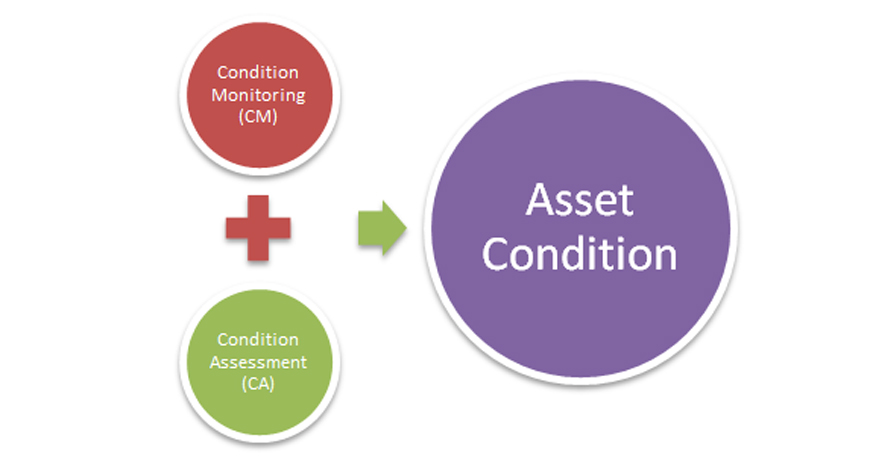
In developing an asset condition program, two main strategies are used to ascertain an asset’s condition. One is Condition Monitoring (CM) and the other is Condition Assessment (CA).
Condition Monitoring (CM) is a quantitative technique that uses instruments to detect component degradation and predict impending failure. Instruments rely on a consistent relationship between their components and the environment to numerically derive the data. For this reason, they are more consistent and precise and deemed to be more objective. Examples of condition monitoring applications typically found in industrial plants include infrared thermography, oil analysis, precision alignment, ultrasonic inspection, vibration analysis, and motor current signature analysis. Some types of condition monitoring are applicable to both static and rotating assets. Infrared thermography, for example, may be applied to switch gears, pipelines and gearboxes.
Condition Assessment (CA) is a qualitative methodology that uses innate human senses and the judgment of experienced technicians to detect component degradation and predict asset failure. In executing condition assessment, assets are inspected by a qualified person, and condition attributes are qualitatively graded according to a pre-defined scale which is then used to identify component degradation over time. This method is still considered qualitative even when numerical scales are added. Condition assessment may also be applied to both static and rotating assets. The most common type of condition assessment applied to industrial plants is the visual inspection.
Given the subjective and inconsistent nature of the human judgment, an instrument that is properly calibrated would be deemed to produce higher-quality asset condition data than data whose sources for which human judgment is the source.
Deriving Value from Proactive Asset Condition Management
The asset condition strategy is an asset management activity that should be determined as part of an overall asset management plan. Condition assessment and condition monitoring are not mutually exclusive. Assets could have both strategies, for example, a motor could have a maintenance strategy that includes both visual inspections, vibration, and oil analysis. Factors influencing the asset condition strategy include the use of RCM and other requirements in the operating context such as legal requirements for pressure vessels.
Proactively managing asset condition allows asset risks to be holistically managed, leading to the creation and protection of asset value. Whatever the final asset condition strategy, executing the asset condition plan should be done via the organization’s work management system. To be useful as asset information for decision-making, asset condition data should be managed in the CMMS/EAM so that it can be analyzed and reported.
Establishing asset condition, as significant as that is, does not prevent or correct asset failures. Failures are mitigated by the proactive actions of the organization. The true value, therefore, of an asset condition program, is in identifying and predicting component degradation and allowing for long-term asset planning and timely mitigation of catastrophic failures.
Check out these upcoming asset management courses from Greeman Asset Management Solutions Inc.:
by Ana Maria Delgado, CRL
Necessary equipment information needed for a successful vibration database can and will vary greatly depending on the person being asked. This variation is due to their involvement with the process; for some, plant criticality defines what they believe to be important; for others, it may be how often a piece of equipment fails.
Generally we would like to have the basic machine configuration such as motor-pump, motor-gearbox-fan, is there belt driven equipment, etc. Also needed are the speeds in RPM or Hz of each shaft involved. What type of bearings—fluid film or rolling element, and their part numbers, as well as coupling type—grid, toothed, fluid, or even rigid. Also needed is mounting type: solid or isolated or set up on boards.
The more information the better, though a program can and is usually started with much less. At a minimum have shaft speeds and bearing type and number of vanes on an impeller or blower wheel. Additional information can be added such as actual bearing part numbers, and the number of stator or rotor poles on a motor, which your motor repair facility should be able to provide. The more information that a vibration database contains the faster the analysis process and the better its accuracy.
Take a look at our Vibration Analysis Tools!
by Yolanda Lopez
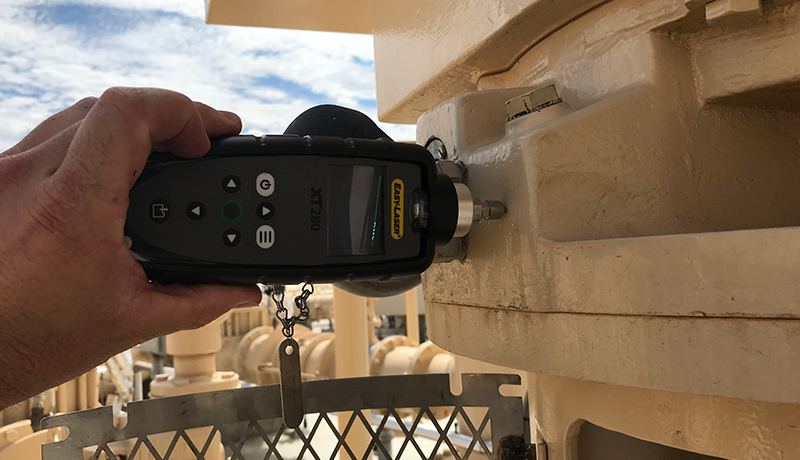 An overall level is a single number representing the amplitude of a vibration measurement. Overall values can be derived many different ways. You should be very cautious when assigning generic or the identical alarm values to your equipment. Similar machines can operate at different vibration levels. The individual characteristics of each machine should be taken into consideration when setting valid alarm levels. Even a simple vibration check revealing acceleration, velocity, unbalance or bearing noise can help you find and prevent equipment faults. You don’t need a sophisticated system for this; just a simple but good handheld tool (such as the EASY-LASER XT280) can help you with this.
by Ana Maria Delgado, CRL
Is it bearing information, number of poles, frame size, number of gears, impellers, blades, horse power, operating voltage, motor type, manufacturer, number of belts, sheave size, or tooth count? Nope! None of the above.
All of the above information is great to have when analyzing vibration data, but the single most important item that is always required is the running speed of the equipment.
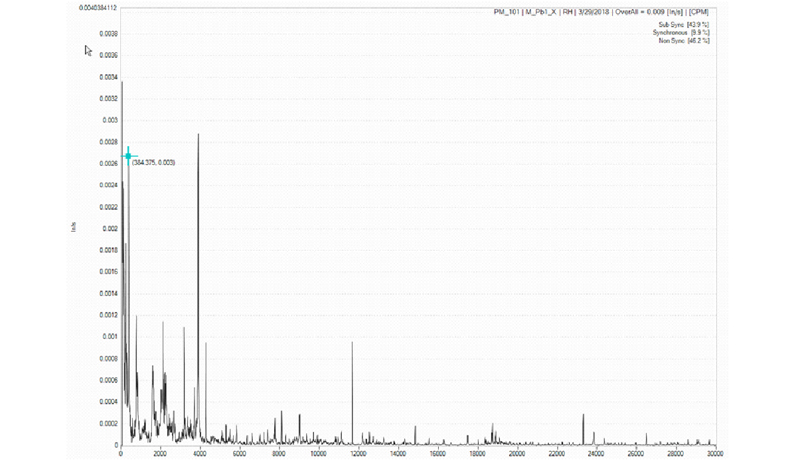
Not knowing the true running speed makes vibration analysis impossible for determining the proper defect to be reported. For example, if the speed was recorded at 1,780 RPM, but the true speed was 3,560 RPM and a high peak at 3,560 RPM is present; it could lead the analyst to believe that the 2× turning peak is related to another issue. Having the proper running speed of the equipment will assist the analyst in making the correct diagnoses for the equipment.
Once the correct turning speed has been identified the spectrum can be broken into three types of energy: sub-synchronous, synchronous, and non-synchronous.
Having this information available can assist the analyst when analyzing the vibration data.
Related Blog: Finding the running speed of a machine
by Yolanda Lopez

In every facility there are pieces of equipment that are critical to the daily operation of the plant. Those machines are the ones that keep you awake at night. If the equipment fails or has a break down unexpectedly it has an adverse effect on production. An online vibration system can assist in giving you peace of mind for the health condition on that equipment.
Using an online system allows for monitoring of critical equipment 24 hours a day, 7 days a week, and 365 days a year. The ability to email or text alerts when alarm thresholds are met or exceeded allows for early detection of failures.
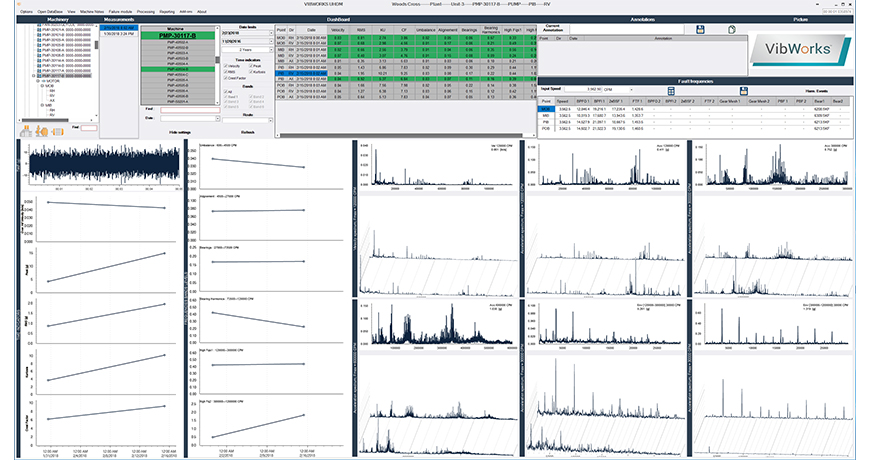
The CORTEX MONITORING SYSTEM (CMS) is a cost-effective, scalable solution, dedicated to the prediction of asset failure and the prevention of catastrophic failures and costly repairs. This innovative system will help you optimize your performance by monitoring the condition of your valuable assets with highly accurate diagnostic tools. CMS allows for easy access to the condition of the equipment at any time and from any place. The software can be accessed via the cloud using IIoT protocols and easily viewed on a phone, tablet, or any internet capable device. The images below show examples of what can be displayed using an internet capable device.
by Yolanda Lopez

Every analyst develops their own process for analyzing vibration data. This is generally learned from others, being around to observe or communicate with, or from training the individual receives. Often, the person collecting the data will be the same person that analyzes the data. The process could include that during the data collection the person not only uses the vibration data collector but also collects physical data from their senses such as sound and smell to see what is going on with the equipment. They ought to look for material under the coupling guard to see if an elastomer coupling is shedding pieces, which may indicate misalignment; look at the oil level if possible for signs of oil leakage; look at the mechanical seal area to identify other leakage. Once data is collected one would generally look for anything outside of established alarm levels, look at the spectrum to see where the highest amplitude peak is at, look for other high amplitude peaks or groups of peaks and harmonic families, and look for sidebands around peaks to help in identifying the source. You would also look for the direction of the highest vibration. Examine the historical data too: you would want to look at the rate of change to determine how quickly failure is approaching. Also never, never forget to look at the time waveform as all data comes from the time waveform. I try to look at the time waveform in the raw units of the sensor as that can verify what you may be seeing in the spectral and give you a greater understanding of just how bad a problem you may be facing.
If you need a solution to help ease this process, consider our BETAVIB vibration analysis systems.
by Yolanda Lopez