
When the breakdown/repair cycle becomes routine, you can bet money is being wasted. The psychology of manufacturing (if we can call it that) is very much overlooked.
Q: What if it was a personal affront to everyone in the plant, management, production, and maintenance, for a machine to break down? Seriously. What if everyone viewed it as a personal failure when a machine failed unexpectedly? Do you think the necessary attention would be given to it? That might be revolutionary.
Of course, if too much time and effort are put into something, the cost will exceed the return, but if the necessary serious attention is given to an operating asset by EVERYONE, the next excellent idea that improves reliability could come from anyone.
“Ownership” is something we know to be beneficial in a manufacturing facility. We know that the more “personal” everyone feels toward the assets, the better they take care of them and the more creative they are about caring for them. When we feel that personal attachment of ownership, we are more forthcoming with our efforts and supportive of the efforts of others who share our valuation of the assets.
With this in mind I offer the following suggestion in order to tap into that inherent pride of ownership and personal attachment that many have to the company and assets of their occupation: LET EVERYONE SEE HOW UGLY IT IS!
Hang a sign on a machine that failed and shut your plant or process down. The sign should read,
This machine FAILED and shut our plant down:
Failed: August 30th, 2011
Failed: May 4th, 2015
Failed: January 19th, 2017
Failed: August 11th, 2018
And keep adding the dates. This way the bad actors become obvious to everyone, and even the MTBF will be obvious. The absence of a sign on a machine could then be as informative as the signs with dates.
If you can succeed in creating ownership of reliability that cuts across department lines, the benefits could be enormous. Failures come from all directions: Operations, maintenance, engineering, management, and procurement. Let everyone see the ugliness of it and encourage everyone to pull together to make it beautiful (or at least more attractive.)
by Yolanda Lopez

- Knows how to use the software package they have.
- Knows how to use the hardware they have.
- Knows where to place the vibration sensor to ensure good data.
- Knows how to recognize bad data.
- Knows what to look for while collecting data besides just the vibration sensor.
- Knows how and to whom to report their findings so that repairs are made, and gets feedback on the repair.
- Knows when to ask for help.
Learn more about LUDECA Vibration Analysis Courses
by Yolanda Lopez
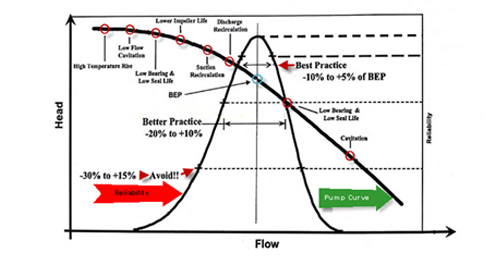
Centrifugal pumps have a specific design point at which they operate most efficiently. This sweet spot is known as the BEP (Best Efficiency Point) which provides the design engineer with the required flow and pressure while also providing the best efficiency. If the pump has been specified incorrectly or is placed into a system that doesn’t have the proper system head, the pump will become a reliability problem child. When a centrifugal pump is placed into a system without the required system resistance, the pump will run off its curve to the right, resulting in early bearing and mechanical seal failures and impeller damage caused by cavitations. If the pump is placed into a system with excessive system resistance, or, as frequently happens, the pump discharge valve is throttled early, bearing and seal failures occur along with impeller problems caused by discharge recirculation. Best practice dictates that the pump be specified and designed to operate within +5% to –10 % of its designed BEP. This will result in lower operating and maintenance costs and a happy pump.
by Yolanda Lopez
There are many different reasons to consider and implement an online vibration system. Some of the key reasons are:
- The equipment is critical to production.
- The equipment has a long repair time.
- The parts for the equipment have a long lead time.
- The equipment is not easy to access.
- The equipment is in a remote location.
- Equipment failure could endanger the environment or people.
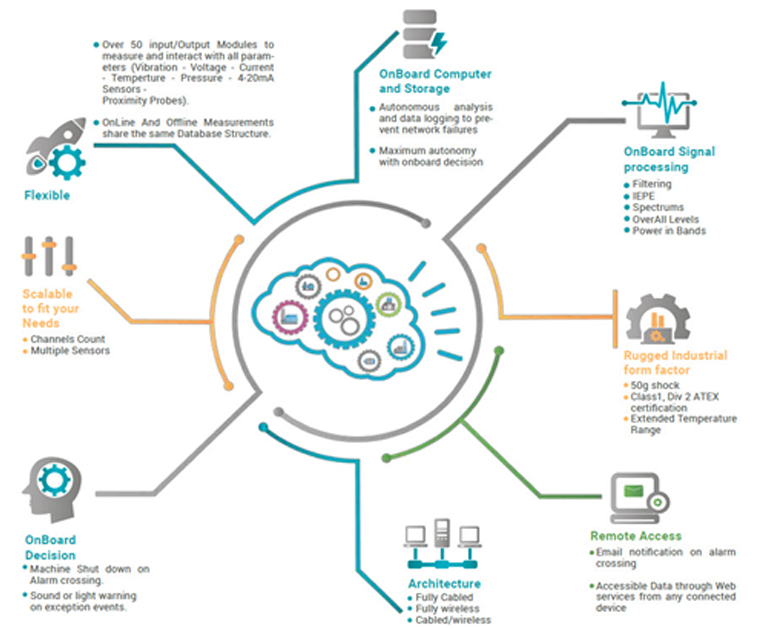
Online systems like the CORTEX by BETAVIB allow not only vibration to be monitored but also many additional parameters (such as speed, temperature, pressure, and flow, to list just a few), all of which can also be monitored and recorded. In addition, a customized overview can also be created to allow anyone to quickly monitor the health of the equipment using red, yellow, and green alarms that will indicate if an issue is present.
The CORTEX Monitoring System (CMS) is a cost-effective, scalable solution, dedicated to the prediction of asset failure and the prevention of catastrophic failures and costly repairs. This innovative system will help you optimize your performance by monitoring the condition of your valuable assets with highly accurate diagnostic tools.
by Yolanda Lopez
This blog post concerns rolling element bearings and not journal bearings.
 When a rolling element bearing begins to deteriorate the damage usually manifests itself in one of the races (either inner or outer) followed by the rolling element, and finally the cage. When the races begin to have defects these tend to excite the natural frequencies of the race which typically show up beyond the maximum frequency that most analyzers collect data to.
The specific defect frequencies are determined by the bearing geometry. One would normally start seeing peaks in the FFT spectrum in the 5× to 7× range and sideband peaks spaced at 1× rotational speed. As the defects progress, harmonics of the component defect frequency will move lower in the FFT with more harmonics showing, while the number and amplitude of the sidebands increases as well.
When you begin to see the defect frequencies of multiple components, then this indicates that the damage is progressing. In the time-waveform’s early stages you will see an increase in the amplitude of the peaks, indicating impacting; as damage increases the amplitude of the impacts will increase and for a time the pattern will resemble what is known as the “angle fish” pattern. This pattern will not last and may not even be seen depending on the frequency of the data collection. The pattern tends to go away because of continued deterioration of the bearing components.
by Yolanda Lopez
In most cases, when equipment is in failure mode, it begins to make sounds that are not commonly heard during normal operating conditions. Once this sound is heard a defect (at least one) is already present in the equipment.
Using our vibration tools can assist in detecting the defect before that sound is heard with the naked ear.
Think of a vibration sensor as a stethoscope that allows a vibration instrument to listen to the heartbeat of the equipment. The heartbeat is then recorded and data can be viewed historically for that equipment. The data can then be compared to other readings collected on the equipment to quickly see if any changes have occurred.
by Yolanda Lopez
1. A Change in the Quantity of Grease Consumed
Maintenance departments track their grease consumption to monitor and control costs. A change in consumption is a sure sign that your lubrication program is on the right track. Most organizations are guilty of over-lubricating. Expect lower grease consumption as your program matures. Bad procedures lead to bearings routinely receiving more grease than they’re designed to handle. The excess ends up being pushed into the motor casing or purged onto the floor.
Over lubrication happens when re-greasing intervals are scheduled based on time instead of condition. Control lubrication tasks with ultrasound to monitor the condition and maintain optimal friction. The time between greasing intervals increases, resulting in less grease used per bearing.
2. Fewer Lube-Related Failures
Do you track failures and perform root cause analysis?
Organizations with optimized greasing programs experience fewer lube-related failures. Less fixing and fire-fighting translates to more creative time for maintenance. Use that time to bring more machines into the greasing program.
Additionally, with ultrasound, you find many non-trendable defects. For example, broken or blocked grease pipes and incorrectly fitted grease paths prevent grease from reaching the bearing.
3. Optimized MRO Spares Management
Your new and improved lubrication program is delivering wins; better control of grease consumption, fewer failures, and more productivity for maintenance. Use this time to study trends and better manage your storeroom.
A decrease in bearing-related failures improves spares optimization. Share your ultrasonic lubrication data with your MRO Stores manager to create a plan to reduce the number of emergency parts on hand.
Since you’re taking stock, why not shift some burden to your suppliers? Ask them to confirm your emergency parts against their own stock. If it can be supplied on the same day then it doesn’t need to be on the balance sheet.
4. Increased Number of Machines Monitored
One benefit of an effective lubrication program is time.
• Time allotted to monitoring machines instead of fixing them.
• Time allotted to correctly assessing the real needs for lubrication.
• Time to look at the big picture.
Take, for instance, criticality assessment. Many lubrication programs begin with small steps. All the “A” critical machines receive priority, and rightly so. But what about the rest? With more time to plan, organize, and schedule, the number of machines acoustically monitored for optimal lubrication increases.
5. Save Time. Combine Acoustic Lubrication and Condition Monitoring
You worked hard for these results. It’s time to use your data for more than just lubrication.
Acoustic lubrication is the proven method to ensure precise bearing lubrication. New technology from SDT, LUBExpert, combines the power of onboard lubrication guidance with Four Condition Indicators for bearing condition assessment.
The time savings from assessing bearing condition during the lubrication process is beyond valuable and another sign your acoustic lubrication program is on the right track.
6. Inspector Confidence at an All-Time High
Reliable machines are the product of an effective lubrication program. You have:
• Managed grease consumption
• Fewer grease related to bearing failures
• Optimized MRO spares
• More machines under watch
• Increased data collection intervals
The power of adding ultrasound to your greasing program delivers win after win for reliability. Reliability breeds confidence. More confident inspectors making the right calls and infecting a positive culture throughout the organization.
by Allan Rienstra - SDT Ultrasound Solutions
1. Collect the best data you can, using a high-quality ultrasonic data collector.
2. Consistent sensor placement must fundamentally be observed.
3. Identifying boundaries that impact data transmission is imperative.
Ultrasound is Shy… It Keeps Boundaries
Think of ultrasound as the quiet introvert. It prefers to stay in, and rarely mixes well with ultrasounds from other places. We call this “boundary behaviour” and it’s another characteristic that makes ultrasound such an attractive condition monitoring technology. Ultrasound signals remain isolated to their source, making it easy to pinpoint defects without interference from other elements of the machine.
Sensor Placement
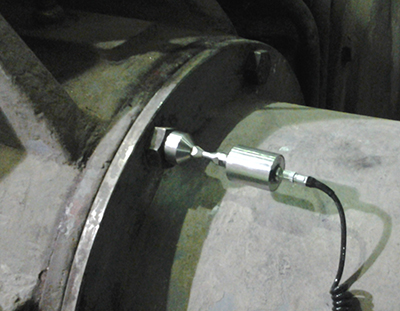
Inspectors tempted to place their ultrasound sensor directly on the gearbox cover should reconsider. This common mistake affects data integrity. A gasket seals the cover plate to the gearbox housing. The specific acoustic impedance of the gasket material differs greatly from the cast metal of the gearbox. The change in materials a boundary barrier through which bashful ultrasound is reluctant to be passed. A better option is to place the sensor on a bolt head, which is directly connected to the gearbox housing. The result is crystal clear ultrasound signals for listening, trending, and condition assessment. HearMore: Click here to listen to Damaged Gearbox.
Special thanks to our partner Allan Rienstra from SDT Ultrasound Solutions for sharing his great knowledge with us!
by Allan Rienstra - SDT Ultrasound Solutions
With the proliferation of online monitoring systems utilizing permanently mounted sensors, users will need to beware of “direction sensitive” vibration and possible sudden unexpected failure due to insufficient data. The thought of insufficient data may seem incredible when thinking of constantly monitored equipment, but consider the all too common (IMHO) practice of uni-directional (one direction) monitoring of machine trains.
Many installations, due to initial cost, are mounting a single vibration sensor at each bearing. While this may be sufficient for most equipment trains, most of the time, it will certainly not be sufficient for all equipment trains all of the time. Although I don’t have hard data available, if I were to make a statement based on personal experience, and anecdotal evidence from other practitioners, my statement would be something like this: “80% of horizontal equipment could be pretty well monitored by sensors mounted at the horizontal radial position on each bearing.” I say pretty well monitored because I just can’t bring myself (as an analyst) to be completely satisfied without the vertical and axial data.
This setup would catch virtually all unbalance and roller bearing faults (excluding thrust bearings), some to most misalignment faults, and a sprinkling of others. I use the word “catch”, to mean it would give an indication of a developing problem. Accurate diagnosis of unbalance, misalignment, bent shaft, and even looseness in many cases (as well as a host of other possible faults) would require more data.
If the online vibration program manager takes these facts into account and governs the program accordingly, they should be pretty successful. If they add to the online program a “full battery” vibration survey, maybe semi-annually, just to catch the less common, but possibly very destructive defects that could develop undetected by the uni-directional monitoring, they would most likely be very successful.
What could be so destructive and yet be completely undetected by the uni-directional sensors? The Big R for one is Resonance. Resonance is often extremely directional. Consider a case history LUDECA co-published with one of our customers in the December 2012 Wastewater Processing magazine:
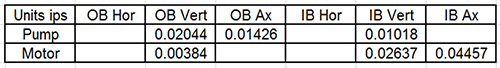
In the table below (Figure 1), the 1× amplitudes are displayed. I have hidden all but the vertical data, as though it were monitored only by vertical sensors.
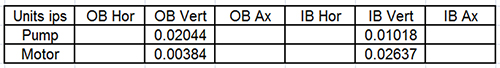
Everything is wonderful right? Look at the motor outboard vertical, only 0.00384 inches per second—very impressive. Of course, at this point you are thinking “he is setting me up for something” and you are correct. Even though most anyone would love to have these amplitudes on virtually any machine, this particular machine was tearing itself apart with vibration!
We will give the reader a little more data, just to help add emphasis to the directional nature of resonance. We will add the axial data to our table in Figure 2:
Still very, very good… so far. Now, look at Figure 3, with the addition of the horizontal data.
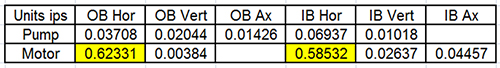
The motor outboard horizontal amplitude is 162 times the amplitude of the motor outboard vertical! What if the user had only vertically mounted sensors? What about vertical with the added information of axial? You may be thinking “if I had only horizontal sensors, I would have been ok”, and for sure you would have been better off than having only vertical. You would at least have known you had a problem, but you would not have known what that problem actually was. You would likely have assumed the vertical and axial are probably vibrating badly too.
Hopefully, you would have verified the vibration in the other directions. As it was, the user had data from all directions and a simple glance told the analyst with a high degree of confidence what the problem was. Resonance is almost alone in creating that kind of directional disparity.
To reiterate, the online vibration program manager should be successful if they take into account the fact of limited data and supplement the online program with a “full battery” vibration survey at a cost-effective interval, just to catch the less common, but possibly very destructive defects that could be developing undetected by uni-directional monitoring.
by Mike Fitch CRL
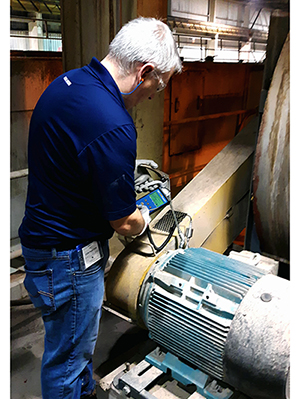
While the person in charge of collecting vibration data is actually collecting the data, they should watch the data “live” for unusually high amplitudes or discontinuities in the data. This will not increase the data collection time, and if any of these issues are detected, the person can evaluate whether or not the data is “good” or not; if not, the data can be recollected, or if it is “good” then additional data may need to be collected to ensure that proper analysis can be performed on the equipment. Field notes can be made about the machine’s condition and its status.
If the machine condition is determined to require attention, the analyst might need to contact someone at the facility. Remember that sudden increases or decreases are usually a sign of machine problems. Looking at or analyzing the data in the field can give the analyst a good idea of what issues need to be analyzed, thereby reducing the time to analyze data in the office. If not analyzing the data on the spot, one can at least make notes to aid in later analysis.
by Gary James CRL
♫ And it’s too late baby now, it’s too late; though we really did try to make it. Something inside has died and I can’t hide and I just can’t fake it…♫
So go some of the lines of the old Carole King hit from 1971. Unfortunately, that pretty well sums up the situation for those sad contemporary souls who have computer crashes but didn’t have their databases backed up on a regular, frequent basis. The part about “I just can’t fake it” is especially true after “Something inside has died” (that is, inside of the computer). When you lose your database or databases, there’s just no faking it.
If you are like most, you get a sick feeling inside just thinking about it, and you resolve to get started soon by making a habit of backing it all up. Procrastinate no longer, friend. Get help from your I.T. department, or if you don’t have one, there are numerous players now, that for a small fee, will back up and protect your important data, either locally or in the cloud.
Don’t wait until you are singing the old Carole King song, “It’s Too Late”. Go ahead and protect yourself.
by Trent Phillips CRL CMRP - Novelis
In today’s fast-paced competitive business world, manufacturers are seeking every competitive advantage they possibly can to increase their production and minimize costs while maintaining product quality. The identification of defects within a machine, reducing equipment failures and unscheduled downtime are increasingly demanded of condition monitoring technologies. Vibration analysis has proven to be one of the most effective tools for identifying mechanical and electrical faults within machinery. Most vibration programs use a combination of online monitoring and offline (walk around) monitoring. Off-line programs require the resources of a trained technician to walk from machine to machine to collect the vibration data.
The primary goal of vibration analysis is to identify faults within a machine and then alert personnel that some type of action needs to occur. Problems start to occur when the needed frequency of the data collection is not aligned with the maintenance strategy. A machine’s criticality, its risk priority, and its failure modes establish the frequency required; however, far too often frequency is determined by the availability of a local contractor, internal staffing, or, even worse, how much money will be saved if the frequency is changed from monthly to quarterly?
Today’s online systems have the ability to provide continuous monitoring and can send alarm notifications which can be incorporated into a site’s process control system so operators are alerted of a problem. Some systems can be configured to distribute emails or even send text messages to specific individuals based on an alarm state. Most vibration analysis systems today also have the ability to monitor and alarm off-process data such as temperature, pressure, voltage, current, flow, or speed and can provide alarming if a process measurement goes outside of a predefined range.
Some of today’s online systems can incorporate onboard logic and decision making and some vendors offer machine diagnostics so that data is analyzed and screened for alarm violations automatically. Data storage can be accomplished by the end-user locally or the data can be stored and accessed via the cloud. Utilizing a cloud server allows Reliability Engineers, Vibration Analysts, or Condition Monitoring Contractors the ability to analyze and view data, alarms, trends, and reports from anywhere in the world.
The “Industrial Internet of Things” (IIOT) is changing the way vibration data is viewed and managed. Developments in Artificial Intelligence, Smart Machines, Embedded Intelligence, Machine Learning, and Data Analytics are changing and significantly affecting how condition monitoring data is collected, processed, and presented to users.
Related Blog: The Importance of Purchasing the Right Vibration Analysis System
by Dave Leach CRL CMRT CMRP
How many facilities only collect vibration data when it doesn’t interfere with other activities? So often collecting and analyzing data is only one part of a given person’s responsibilities and workloads dictate that the collection and/or analysis take a back seat. When this happens, machine problems are not detected and therefore not reported for corrective action to be taken. If a machine then fails management has all the right to ask why the problem was not found and reported, even if management itself is the reason the data was not collected or analyzed! Vibration data collected should also be analyzed in a timely manner (within two business days of collection) to allow for proper scheduling of any needed repairs; of course, if problems are detected while collecting data that are believed to be severe enough to merit immediate attention, then they should be reported immediately to the facility. Many analysts do not know how long it will take to approve, plan, order parts, kit out, and schedule the resources to execute the repair work. Therefore, one must collect, analyze, and report the data as soon as possible. Generally, you may find several problems in most facilities; however, if you hand in 20 or 30 reports to the Reliability contact, they can quickly be overloaded. I would collate and deliver all the necessary reports but would focus on the top 5 priority problems first, based on safety, criticality, severity, and production demand.
by Trent Phillips CRL CMRP - Novelis
Condition Monitoring Expert Tip #9 by Mobius Institute
No, sadly, that may not be correct. If the spectrum (and phase readings) indicate misalignment, then the machine will be misaligned. But if there is no indication of misalignment, the machine may still be misaligned. I know that may not make sense, but unfortunately, it is true.
A number of experiments have been performed where real machines were misaligned and the vibration pattern did not change. The vibration pattern depended upon the type of coupling and other conditions, but the bottom line is that the only way you can be sure that the machine is precision aligned is to precision align the machine with a laser alignment tool.
We appreciate Mobius Institute for allowing us to share this tip with you!
by Ana Maria Delgado, CRL
Condition Monitoring Expert Tip #7 by Mobius Institute
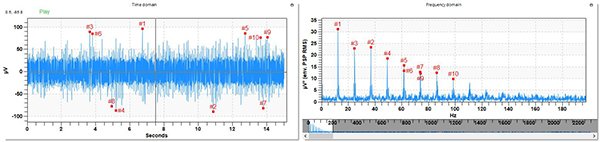
Spectrum analysis provides a great deal of information about the health of rotating machinery. But you should consider the spectrum as a summary of the vibration within the machine.
The Fast Fourier Transform takes the time waveform and computes how much of each frequency is present and displays that as a line in the spectrum (grossly summarized, but that is basically the case). Therefore, if the vibration from the machine is generated by smooth periodic motion, then the spectrum provides a very good representation of what is happening inside the machine. But as damaged gears mesh together, and rolling elements pass over damaged areas on the raceway of the bearing, and as the pump vanes push through the fluid causing turbulence or cavitation, the vibration generated is not smooth and periodic. And there are a lot of other fault conditions that likewise do not generate smooth and periodic vibration. Thus, the only way to really understand what is happening inside the machine is to study the time waveform.
The time waveform is a record of exactly what happened from moment to moment as the shaft turns, the gears mesh, the vanes pass through fluid, and the rolling elements roll around the bearing. Each minute change that results from impacts, rubs, scrapes, rattles, surges, and so much more is recorded in the time waveform and then summarized in the spectrum. Therefore, it is critical to record the time waveform correctly and analyze it when you have any suspicion that a fault condition exists.
Special thanks to Mobius Institute for letting us share this condition monitoring expert tip with you!
by Ana Maria Delgado, CRL
Condition Monitoring Expert Tip #6 by Mobius Institute
The vibration spectrum can provide a clear indication of certain fault conditions, but when you see a large peak at the running speed (1X) what will your diagnosis be? What if you also see peaks at 2X and 3X? Now, if you are monitoring a large fan with a history of building up on the fan blades, then you may reasonably conclude that the high 1X peak indicates unbalance. But in the more general case, how do you distinguish between unbalance, bent shaft, looseness, resonance, eccentricity, misalignment, cocked bearing, and other fault conditions? This is where phase analysis is your friend.
Once upon a time phase analysis was difficult to perform because most people owned single-channel vibration analyzers. But with a two-channel analyzer and two vibration sensors, it is very easy to perform phase analysis. By simply placing one sensor vertically on the bearing and one sensor horizontally you can determine if unbalance exists. By comparing the vibration from one end of the machine to the other (on the same axis) you can confirm the unbalance diagnosis and assess whether it requires single-plane balance or two-plane. Comparing phase axially across a coupling, and radially across the coupling can help you diagnose and confirm misalignment.
We could go on and on, but phase analysis is the best tool for distinguishing between all of the listed fault conditions and more.
by Yolanda Lopez
Condition Monitoring Expert Tip #5 by Mobius Institute
Now, this is a tricky question to answer… We have a few contenders: high-frequency vibration analysis, regular vibration analysis, ultrasound, oil analysis, wear particle analysis, and infrared analysis. Let’s start by ruling a few of them out.
Infrared analysis is used to detect heat in a bearing, which is a late-stage fault condition, so that’s not your best option. Regular oil analysis can detect the presence of the wear metals within the bearing, but wear particle analysis is a better tool for that. Regular vibration analysis (i.e. velocity spectra) provides very clear indications of bearing faults, however, the high-frequency detection techniques provide an earlier warning. That leaves high-frequency vibration analysis, ultrasound, and wear particle analysis.
Ultrasound is the easiest to use. Push the probe against the bearing and listen carefully and you will hear if the bearing is in distress. (You can also record and analyze a waveform, but now you may as well be performing vibration analysis). Many would argue that high-frequency vibration analysis (such as enveloping, PeakVue, shock pulse, and others) provides a clearer indication of the nature and the severity of the fault. But it does require more training and potentially a more expensive system to perform the collection and analysis.
And that leaves wear particle analysis. Let’s just say that if you own critical gearboxes, you absolutely must perform wear particle analysis. Performed correctly, you will detect the first signs of wear, and complex gearboxes provide a greater challenge for the vibration analyst and the ultrasound tools.
Although I haven’t really answered the question, I am hoping to have put you in a position to make the right decision for your situation.
Thank you Mobius Institute for this valuable tip!
by Yolanda Lopez
Condition Monitoring Expert Tip #4 by Mobius Institute
This tip is sponsored by IMVAC (International Machine Vibration Analysis Conference)
There is no doubt that technologies such as vibration analysis, oil analysis, ultrasound, and infrared are very powerful. They can tell you a great deal about fault conditions in rotating machinery, electrical systems, and more. But if the criticality warrants it, you will be in a much stronger position if you have multiple technologies indicating that a fault condition exists rather than relying on just one.
For example, if vibration analysis indicates there is a problem in a gearbox, oil analysis can confirm the fault with the presence of wear particles. In the case of vibration analysis, you can utilize high-frequency analysis, spectrum analysis, time waveform analysis, and phase analysis to enable you to validate your diagnosis.
There can be a great deal at stake when you make a diagnostic call on a piece of equipment. More so if it is critical equipment. At the very least, a false diagnosis may lead to equipment failure (if you miss the fault condition) or it can lead to unnecessary work and downtime. What’s more, your reputation is at stake. Sadly, people often forget when you make the right call, but it can take years for people to forget when you make the wrong call.
Thanks, Mobius Institute for sharing such valuable information with us!
by Ana Maria Delgado, CRL
Condition Monitoring Expert Tip #3 by Mobius Institute
This tip is sponsored by IMVAC (International Machine Vibration Analysis Conference)
How do you decide which assets should be monitored? How do you decide whether you can justify the use of more than one technology? Criticality analysis provides a means to prioritize which assets will be monitored and how much effort will be put into collecting data and performing the analysis.
Criticality analysis considers several factors. It will consider the consequences of failure, for example, health and safety, harm to the environment, downtime and production losses, availability of spares, cost of spares, etc. It will also consider the reliability of the asset; how likely is it to develop a fault condition. And it should also consider the detectability of the fault conditions. Therefore, an unreliable asset where failure would lead to dire consequences and where we currently cannot detect the onset of failure absolutely requires condition monitoring and can justify multiple technologies. At the other extreme, a reliable asset’s minimal consequences of failure may not require any condition monitoring; we may employ “run to failure”.
Criticality analysis enables you to make the best use of your limited resources.
Special thanks to Mobius Institute for allowing us to share this condition monitoring expert tip with you!
by Yolanda Lopez
Condition Monitoring Expert Tip #2 by Mobius Institute
This tip is sponsored by IMVAC (International Machine Vibration Analysis Conference)
How do you decide how often measurements should be taken?
Regardless of the condition monitoring technology, you must decide how often measurements will be taken. At one extreme, it could be a permanent monitoring system that takes measurements every split second of every day. On the other extreme, it may be infrared analysis that is performed once a year. But how do you make that decision?
The most common answer we receive is that it is based on the criticality of the equipment. More frequent measurements are taken on the more critical equipment. The next most common answer is that it is based on reliability. If you have been monitoring a machine with vibration analysis every 30 days and have not detected a fault for a year you may decide to test it every 60 days, or 90 days. Now, it is true that you have to decide how best to use your precious time. But the one factor often forgotten is the “PF interval”.
The PF interval, also known as the “lead time to failure”, is the time between when you can detect the fault condition and when the equipment will have “functionally failed” – i.e. it can no longer be used. If we use the right technologies with the correct settings and we take frequent measurements, then we will get the earliest warning, and therefore we have the greatest lead time to act. However, if the PF interval is short, then it is possible that if you have extended the measurement period to 90 days, the equipment may develop a fault and fail before you take the next measurement.
There is a lot more that could be said on this topic but suffice to say that it is essential that you understand the PF interval and continue to monitor equipment so that you take at least two measurements between the time the fault is detectable and when the asset will have functionally failed.
Special thanks to Mobius Institute for allowing us to share this condition monitoring expert tip with you!
by Yolanda Lopez