We previously discussed in this series, Do we really need Oil Analysis if We’re Performing other CM Techniques? – Part 1. In this follow-up blog, we will discuss reading the oil analysis report.
Part 2 – Reading the oil analysis report
An oil analysis report can seem like a lot of numbers and colors all jumbled together for those who may not be familiar with it. The basic element of all reports is that they provide the values seen in your equipment and compare them to those given by the OEM or seen in the field. Some labs provide the reference values while others just stipulate whether they are either within the limits or outside of them. Labs may also provide some advice on courses of action to get help return the oil to normal values.
Oil analysis reports are similar to blood test reports, there are a lot of values and limits but only when we can interpret them properly do they actually make sense. For instance, if the blood report stated that the cholesterol levels were getting into the warning range, we can then adjust our diet and lifestyle to help reduce these. Similarly, with the oil analysis tests, based on the values in the report, we can inspect the machine for evidence of wear or schedule some preventive maintenance accordingly.
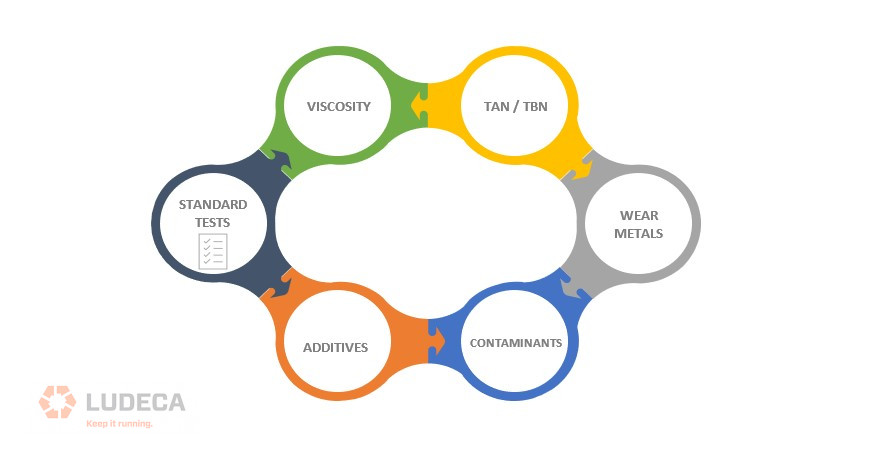
Standard tests within the industry are those which give an overview of the overall health of the oil. Typically, this measure the oil’s viscosity, TBN/TAN, presence of wear metals, contaminants, and additive packages. These properties can guide the user to understand what is happening in their equipment and possibly perform corrective actions before the asset reaches the failure point (on the P-F curve).
The oil’s viscosity is usually measured using the ISO grading system. In this system, the actual viscosity of the oil is placed within a grade. For instance, an oil with a viscosity of 63cSt or 73cSt will be classed as an ISO 68 oil. Thus an ISO 68 grade doesn’t necessarily translate to an oil with a viscosity of 68cSt. With the ISO grades, they have a range of +/-10%. The range for an ISO 68 oil lies between 61.2 CST and 74.8cSt, if it falls out of this range it is no longer classified as an ISO 68 oil. A good reference value for used oil is a change of +/-5% which can determine whether degradation has occurred or not.
The TAN (Total Acid Number) or TBN (Total Base Number) values depict the amount of acid which is being built up in the oil. Engine oils have TBN values while other industrial oils have TAN values. In engine oils, a decrease of approximately 50% of the TBN value is a cause for concern. Any type of acid within your system is not good and a decrease of the TBN by 50% means that the acid level has increased by the same amount. On the other hand, an increase of 0.2 mgKOH/g is a cause for concern in other oils.
The presence of wear metals indicates that there is some form of wear occurring within the equipment. Depending on the type of wear metal which has been detected, one can pinpoint the source of wear. For instance, if the levels of chromium keep increasing in the oil analysis reports and the asset has chrome rings then the source of wear could be isolated to these rings. Thus during maintenance, they can be inspected for wear. Different OEMs have varying values for their equipment especially based on the environment in which they operate, so the best advice is to follow their guidelines or those of the lab for this equipment.
Contaminants are the bad actors which can cause major problems. Just like a pebble in your shoe, contaminants can cause a lot of misery to the equipment it affects. This is particularly important for hydraulic oils where contamination is a huge challenge especially due to the small clearances in this type of equipment. Most OEMs have guidelines on the amount of tolerable contamination for their equipment.
Additives are sacrificial in that their main purpose is to be depleted. However, when this depletion begins at an accelerated rate, that’s when they may no longer be protecting the oil. This is where most of the issues begin. While Oil manufacturers don’t give out the ratio of the additives in their blends, it is always a wise idea to perform oil analysis on a new oil sample and use this as your reference for all the other samples.
These properties help to determine the health of the oil. Thus, by monitoring them, we can get a better picture of what is happening inside the equipment. Remember, changes in the oil are a reflection of what is occurring within the equipment. For instance, if the TBN value drops drastically by 60% or more within one week of the oil being in the equipment, this can indicate the presence of fuel dilution. If the viscosity has also decreased significantly with the 60% decrease in TBN then a possible cause can be fuel dilution. This is the importance of trending the data along with the various properties so hypotheses can be made and then verified through checks.
While these are just some of the standard tests, specialty tests also exist when we’re trying to determine other factors. For instance, in turbine oils, if the viscosity levels are a bit higher than expected or the additive values have dropped to a concerning level, operators may want to investigate the presence of varnish. Varnish can be detrimental to the equipment as it causes a lot of unplanned downtime. Deposits can stick to the insides of the equipment and insulate heat causing equipment temperatures to rise outside of the operating ranges.
The two main types of test to be done for varnish would include; MPC (Membrane Patch Calorimetry) where the oil is passed through a patch and a value is given based on the patch intensity. This can tell us if there are deposits in the oil or varnish pre-cursors. The next test would be the RULER (Remaining Useful Life Evaluation Routine) test which gives a quantitative value of the remaining antioxidants (both primary and secondary) for the oil. This can tell us if oxidation is present and whether the antioxidants have significantly depleted or not. In part 3 of this series, we will talk a bit more about the other types of condition monitoring techniques as well as the method for selecting the best one for your equipment. Stay tuned!
Thank you Sanya Mathura with Strategic Reliability Solutions Ltd for sharing this informative and educational article with us!
Filed under:
Condition Monitoring, Lubrication by Diana Pereda