Advanced vibration analyzers like the VibXpert® have powerful analytical features that often go underutilized. One such feature is the ability to acquire continuous (live) vibration measurements. This can be utilized to check for measurement signal stability and quality. However, it can also be used for additional analytical troubleshooting as well. Continuous (live) vibration data can be used to determine if electrical energy (faults, etc.) is present in electrical motors. Set your vibration analyzer to continuous monitoring. Identify and watch the peaks in question.
Turn the motor off while watching the peak(s) in the measured data. Peak(s) that disappear immediately when motor power is turned off are related to electrical energy. The remaining vibration data is associated with rotating components within the equipment.
Continuous data collection can be activated in the VibXpert analyzer by selecting the Multi-Mode icon and then the Data Collection icon that will be used. Press the Menu key, select the display setup option and toggle continuous measurement to “Yes” (it is set to “No” by default). Alternatively, you can activate the live mode by keeping the “Enter” key pressed when the measurement starts. The actual data collection begins when you release the “Enter” key.
by Mickey Harp CRL
Guest post by Brad Loucks, Mechanical Engineer at Pioneer Engineering
In a condition monitoring vibration program, determining the appropriate intervals of data collection is just as important as the data that is being analyzed. Properly scheduled data collection intervals of equipment provide data analysts with a better picture of how equipment is performing over a period of time. Having a history of data is important for an effective condition monitoring vibration program and this is done by establishing correct data collection intervals.
Data collection intervals should be established and executed with purpose, not done randomly. To establish intervals, it is important to know and understand how the equipment works. Determining the appropriate time interval between collections is done by identifying how often the equipment runs, how fast it runs, and the application. The calculations are based on the estimated life cycle of the bearings but also the estimated amount of time it takes to go from a defect to a complete failure.
Collection intervals should be a routine function. Many times data collection falls behind because the collection person is too busy to collect the data. One of the most common issues that I have come across is that plants will begin to collect data and then the person collecting the data gets pulled to do other work and the data collection gets missed and becomes more random. This is a slippery slope in that it almost always leads to the data no longer being collected. Then when an emergency comes up such as a bad-sounding machine, the analysis has not been collecting history on the equipment but they have also been out of the analysis for so long that they have a difficult time remembering how to analyze. The history and interval are just as important for proper analysis as it helps to give the analyst a more accurate analysis by allowing them to see the progression timeline.
Bearings often do not fail in a predictable time span. If this were the case, vibration analysis could be overlooked and time-based maintenance could be used. A bearing can go from a known defect to catastrophic failure over the course of a few years or it can happen within minutes. The collection intervals are calculated so that not only can data be collected and the severe defects be identified, but also to identify when a defect has formed and allowed for a history to be built in order to watch the progression of the defect. This can aid in determining whether immediate action should be taken or if the defect is at an early enough stage where proper planning and measures can be taken to avoid an immediate shutdown and loss of production.
If the equipment is deemed valuable enough or if unplanned downtime is just out of the question, then calculated collection intervals are a necessity of a proper condition monitoring vibration program. Through proper maintenance, a condition monitoring vibration program can save a plant both time and money in reducing or eliminating unplanned downtime, as well as significantly reduce the possibility of injury or death of plant staff due to catastrophic equipment failure.
by Ana Maria Delgado, CRL
Engineering advancements have resulted in many different types and grades of lubricants being available for equipment maintenance. Unfortunately, the risk of improper selection and mixing of lubricants has increased as well. Mixing different types of lubricants (grease and oil, etc.) within a machine is one of the most common equipment reliability problems. Doing so can result in unanticipated chemical reactions and equipment failures.
Proper labeling is a method to help ensure that the correct type of grease or lubricant is being injected into your equipment. Color-coded labels with proper lubricant identification markings should be placed on the Zerk fitting or near any lubrication entry point on a machine. Grease guns and lubricant containers should have the same color identification and markings as well. This simple process can assist in eliminating lubricant contamination and thereby prevent one of the most common reliability problems today.
by Mickey Harp CRL
Guest post by Ray DeHerrera, Mechanical Engineer at Pioneer Engineering
Vibration analysts use multiple tools to predict a potential fault in a machine; from transducers to accelerometers, the toolbox for vibration analysts is continually expanding to allow for more comprehensive and accurate data collection and interpretation. One tool that is absolutely important to the data analysis process is knowing how your equipment processes data. Vibration analysts need to know how results are being derived from multiple calculations within your equipment. This allows for the development of an efficient collection history that will produce more accurate results.
The calculations attempt to translate data banks into a model that can then explain the events occurring inside of your equipment. Often times the computer-processed model may develop imaginary information, thus leading to more questions than answers. With basic background and knowledge of variables that may affect your post-processed data, your questions will start to be answered.
To introduce the initial creation of our mathematical model that is displayed upon our data collector or computer screen, (such as the time waveform or spectrum) we will explore commonly used hardware such as the transducer. In general, the function of the transducer is to convert one form of energy into another. A commonly used transducer for case-mounted readings is an accelerometer. The accelerometer mimics mechanical vibrations to produce a usable signal. The usable signal is so small that typically an internal amplifier will be needed for your data collector to harness the information. This process is the initial creation of our mathematical model of data, which has been created from a response of a mechanical device (transducer) sitting upon a machine and is now being converted to a digital signal that has been amplified.
Now our signal must be stored for further analysis. There are a number of vibration collector types and manufacturers. The collector is very similar to a computer giving it the ability to quickly process the original signal into various mathematical models. One must take the time to do their research before purchasing a collector and the associated software. Many desired post-processing and collection capabilities may be limited such as sampling rates. With a good collector and setup, your mathematical models will be accurate. The accuracy and consistency in your collections are key when managing your periodic collections.
The basic knowledge of how your equipment generates your post-processed model will make your time more efficient and your results accurate. The analyst will be able to identify data that is imaginary and pick out what is real. Take the time to understand your hardware and how your computer generates each model.
by Ana Maria Delgado, CRL
Have you ever collected data and uploaded the data back into OMNITREND® only to realize that you have duplicate data in your database? As a technician, you are pressed for time and your boss needs that report like yesterday. Every so often, when uploading the data you can get distracted by other people or from trying to juggle too many things at once, and you inadvertently upload the data twice.
You can delete the duplicated data without having to delete each one by one! Here’s how:
• Click Tools
• Select Report
• Select OMNITREND Web
• Click OK
• Click Database
• Select Database Utilities
• Select Data cleanup
• Once the data cleanup is complete click Close
• In OMNITREND click Database
• Select Database Utilities
• Select Compact & Repair
Once the Compact & Repair process is complete you can go into Machinery Manager, drill down into your database, select the task and then click the Edit Meas. Data tab on the right-hand side of the screen, and you will notice the duplicate data has been deleted.
by Myrna Michel
Guest post by Brad Loucks, Mechanical Engineer at Pioneer Engineering
When discussing machine lubrication techniques and associated maintenance tasks with industry personnel, I often hear the same story; “Once a month, we fill it up until it’s full.” This story can unfold further to reveal that every piece of machinery under such a program receives the same type of lubricant with no considerations made to temperature change, operating conditions, load requirements, and duty cycle. Technology has come a long way over the past several decades in every corner of the modern world and machine lubrication and oil analysis is no exception to this evolution. It has been discovered that choosing the right lubricant for the application significantly prolongs machine life and maintains the overall health of rotating equipment in use today.
To further illustrate this point, just consider how much thought is given to the type of oil used in your car. You won’t find a can of automobile oil in the store that is simply labeled, “Oil”. Instead, you will find several types of oil that are specifically designed to resist large viscosity changes with changing temperature. The ability to resist significant viscosity change is depicted using the nomenclature, “10W-30”, or “5W-40”, etc. A common misconception is that the “W” stands for weight. Instead, the “W” stands for “winter”, and the number that precedes it represents the oil’s ability to resist thickening when the temperature is 0° Fahrenheit. Similarly, the second number represents the oil’s ability to resist thinning in an environment where the temperature is 100° Fahrenheit.
As you can see, the operating environment and temperature play a big role in choosing the right lubrication to extend the life of an automobile engine. In an industrial setting, machine lubrication plays an even larger role with proportional consequences and benefits to the amount of thought and detail given to choosing the right lubrication.
Recent advancements in technology now provide us with additional tools to collect and analyze oil samples in rotating machinery. In doing so, maintenance technicians are able to better understand the present health of their equipment as well as make determinations for further maintenance tasks to be performed. The difference between this story and the “Once a month, we fill it up until it’s full” story, is that we now have the ability to schedule maintenance tasks based on condition, instead of relying solely on a time trigger. A proper machine lubrication program enables us to recognize the root causes of machinery failure due to improper lubrication. A successful lubrication program also incorporates methods for identifying lubricant contamination and implements the best practices in lubricant storage, handling, and dispensing. By introducing these condition-based methods of scheduling maintenance tasks, machinery health is better managed, saving time and money.
by Ana Maria Delgado, CRL
Ingression can be defined as going in or entering, a right or permission to enter, or a means or place of entering. It is important to understand, recognize, detect and reduce the effects of particle ingression. Doing so will have a very positive effect on your maintenance and reliability efforts.
Dirt is often the root cause leading to bearing damage and reduced equipment reliability. If not monitored correctly, ingression can lead to unexpected failures resulting in high maintenance and inventory costs.
When measured in the Moh’s Hardness scale, dirt is typically more abrasive than the bearing material. This leads to pitting and other damage to the bearing that reduces the life of the equipment. It’s really quite simple: under great load, something has to give and it’s usually the bearings, gears, pump impellers, etc. Our goal should be to remove contaminants from the lubricant to our target cleanliness before placing it in our equipment. Doing so will increase our equipment reliability.
by Pete Oviedo Jr
If you have a vertical flange-mounted motor and need to shim it to correct angularity, our laser systems provide the following handy options to accomplish this:
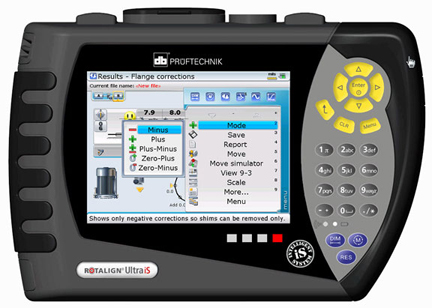
How to decide which option to use?
MINUS: If you have plenty of shims already there, you can select this option to minimize the number of shims used, since the correction will be accomplished by removing (subtracting) shims.
PLUS: if you have no shims between the motor flange and support flange, to begin with, you can select this option to affect the correction by only adding shims.
PLUS-MINUS: With this option, exactly half of your corrections will be positive (adding shims) and half will be negative (removing shims). This option is very handy if your pump impeller hangs from the thrust bearing in the motor and you do not want to change the pump shaft’s axial position. The plus-minus option makes your pivot point the shaft centerline itself so that the correction will have no z-axis effect on the shaft from shimming at all. This also minimizes the absolute amount of shimming needed.
ZERO-PLUS: This option means all positive shimming but forces one bolt location to be zero (no correction). This is very handy when the bolt circle diameter is the same as the flange diameter, or you already have some shims between the flanges to start with and want to minimize the amount of shimming needed.
ZERO-MINUS: This solution is similar to ZERO-PLUS but in the negative direction, meaning all corrections call for removing shims, with one bolt position at zero correction. This is handy if you have lots of shims already between the flanges and want to reduce these while minimizing the corrections needed.
by Carlos Bienes CRL
For the highest confidence level possible while doing predictive vibration analysis work, the location and placement of your sensor are crucially important to you. However, sensor placement is sometimes a trade-off between time, safety, and precision.
Most equipment is mounted with the shaft oriented horizontally to the ground and the analyst must decide whether to take a radial horizontal measurement, radial vertical measurement, a shaft axial measurement, or some combination of the three. If the analyst has the time, there is good reason to take all three positions. When it comes to analysis, an analyst can always choose not to view data he or she has, but can never choose to view data he or she did not collect.
Where should I place my sensor? The answer to this question should come from a focused consideration of what each possible position offers to the overall analysis effort. The fundamental consideration in placing your sensor is that the vibration signal from the component or components of interest should take the path of least resistance to the sensor. This should be coupled with thought given to how every likely defect frequency presents itself relative to direction.
Many fault diagnoses are determined, or the level of confidence enhanced, by relating one location result to another. For example, a high 1× vibration in the horizontal direction on a direct drive center-hung rotor could mean a lot of things, if taken by itself. But if this information is coupled with the additional hypothetical data below:
- The axial vibration is also high: then possible misalignment or bent shaft becomes likelier.
- The axial is low, but the vertical is 1-½ times as high as the horizontal: Now looseness is probable.
- The axial is low, and the vertical is ½ of the horizontal: probable unbalance.
- The axial and vertical are both very low relative to the horizontal: In fact, the horizontal is 75 to 100 times the axial and vertical! Almost unquestionably there is a resonance problem.
In all of the above scenarios, a phase and visual inspection are required to deliver a truly confident diagnosis, but the directional aspect of data analysis is clearly shown.
Trending puts still further demands on the analyst by requiring each successive measurement to be taken in exactly the same place as before, to the extent possible. For parameters to be reliably trendable, operating states and data collection states need to be the same from measurement to measurement.
A real danger for the analyst using portable vibration data collectors lies in the monotonous repetition of placing a sensor hundreds of times in a day of data gathering and becoming careless when making that next placement. If feasible, routes should be kept small enough to help avoid the human factor. It’s too easy to daydream while collecting data. A route under 200 points helps keep the monotony away. The analyst should focus on both safety and data collection precision throughout each route. Happy defect hunting!
by Mike Fitch CRL
Proper location is very important when collecting vibration measurements on a belt system. If possible, one reading should be taken in line with the sheaves and one reading perpendicular to them on each bearing. Vibration data resolution should be taken into account so that proper separation between belt and driver frequencies can be obtained. Care should be taken to ensure proper belt alignment as well. A laser pulley alignment tool provides the most efficient means to properly align belts. Another issue is how the belts are installed. Was the equipment loosened and the belt put on properly? Were the belts instead rolled on by force, creating potential issues? Have you ever seen a Vee belt running upside down? This is usually caused by the cording in the back of the belt being broken often caused by rolling on the belts. Are sheave gauges being used to check the sheaves for wear? In some cases, the cost of a belt is more than the cost of a new sheave. These are just some of the things to consider for proper installation, maintenance, and identification of belt-related problems.
Don’t just assume that belts are simple and do not require best practice actions for proper operation.
by Gary James CRL
Every analyst has a few things they really don’t want to hear during the course of their work. These comments often indicate that proper maintenance activities have not been performed on the equipment, or convey unrealistic expectations of the analyst’s abilities. For instance:
- “It has always run like that!”
- “It really was making a noise before you arrived.”
- “We don’t have time to change the bearings. Just balance the machine so we can run it.”
- “How long will it last?”
- “Those bearings are brand new so I know they’re good.”
- “Yeah, we just use a torch to heat bearings to install them.” Use an EDDYTHERM® induction heater with automatic demagnetizing to properly install your bearings.
- “We don’t have a bearing heater so we use a pipe and hammer to drive the bearing on.” Use an EDDYTHERM induction heater with automatic demagnetizing to properly install your bearings.
- “All we collect are overall vibration values, they tell us everything we need to know.”
- “It doesn’t take us long to change belts cause we just roll them on.” Very bad practice! Use a laser tool like the SHEAVEMASTER and loosen the feet of the motor before installing the new belts.
- “We don’t use no fancy alignment tool. All we need is a straight edge.” A recipe for disaster! Get a good laser shaft alignment system like the SHAFTALIGN® —the money this will save in lost production and unnecessary repairs will more than pay for itself, not to mention the time saved for the analyst who can now dedicate himself to finding other more complex vibration problems.
- “My screwdriver does not confirm your analysis!”
- “You found the problem. Now go fix it.”
- “I didn’t realize you needed training.” Sign-up for a LUDECA vibration analysis training class.
- “I didn’t realize that this CM technology would create so much work.”
- “We need you to stop using that CM technology and turn wrenches this week.”
- “We didn’t realize you had identified and created a work order to fix that problem before it failed.”
No doubt you’ve heard a few more! Feel free to share them with us.
by Gary James CRL
The customer needed to align a boiler feed pump to a fluid drive.
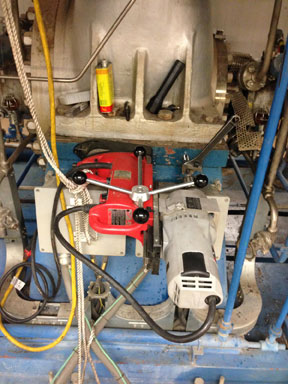
Before doing so, we took care of the simple but often-ignored pre-alignment checks, including a thorough cleaning up of the area around the machines. The area was a mess to start with, and cleaning up allowed us to check for soft foot and start making moves immediately after taking readings, without delays.
Some of the essential clean-up and preparation tasks we performed were:
- Clean up the work area.
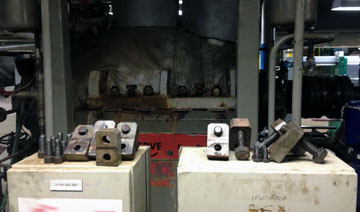
- Remove jacking bolt fixtures and wire brush the corrosion off them.
- Cleaning and greasing the hold-down bolts and jack bolts with white lithium grease.
- Drilled and tapped new holes in the base to add jack bolts where there weren’t any.
- Replaced dirty used shims with new precut stainless steel shims.
- Rough aligned the pump so its anchor bolts were centered in bolt holes of the feet.
This preparation work saved much time on the actual alignment, and more importantly, ensures that the next time this job must be performed the jackscrews, base, and anchor bolts will be in good condition, allowing the machines to be quickly and accurately realigned.
by Carlos Bienes CRL
On a recent visit to a plant, I came across this dial indicator with a calibration sticker.
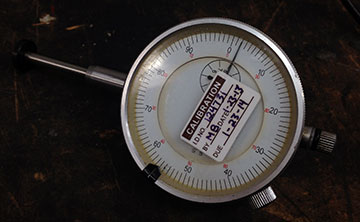
How often are your dial indicators calibrated? You depend on them for precise 1 thousandth accurate measurements, or tighter for high accuracy dial indicators. Routine calibration inspection should be performed on any precision measurement instrument. This includes your laser shaft alignment equipment.
Here’s the calibration sticker on the back of a ROTALIGN® iS intelligent sensor. LUDECA offers state-of-the-art NIST traceable calibration inspection and certification which is recommended every two years for our laser alignment systems. Knowing that you can depend on your readings the next time you align a critical machine will give you peace of mind and reduce liability.
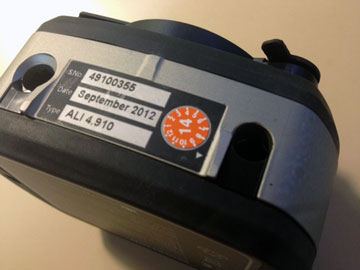
LUDECA’s calibration lab is a factory-authorized, NIST and NUPIC certified facility to calibrate your ROTALIGN®, OPTALIGN®, and VIBXPERT® systems in the United States. Sending your system in for calibration is fast and is just a small routine cost compared to the potential consequences of not having it done.
Can you afford to risk your machines and safety? Beware of non-authorized entities that purport to offer calibration services.
by Daus Studenberg CRL
As a vibration monitoring program becomes more mature, the number of monitoring points on a machine and throughout a facility can increase to a very high number. These additional monitoring points are required to identify potential failures and maintain a world-class reliability program. Unfortunately, these additional measurement points usually result in an increase in the time required to complete the data acquisition (routes).
Consider using a triaxial accelerometer with a magnetic base along with a vibration analyzer such as the VibXpert® II. This combination will allow the acquisition of multiple measurement points simultaneously and guarantee that proper data is being collected. You will be able to achieve the desired results with the highest analytical accuracy and greatest labor efficiency.
by Mario Rostran CRL
- Shaft speed of machine being analyzed
- Type of bearings involved (sleeve vs. rolling element)
- Rolling element bearing part number(s) and manufacturer(s)
- Internal configuration of equipment
- Machine History
- Proper data collection location
- Proper sensor to use for data collection
- Proper data collection setups to ensure correct data is collected
- Is the primary energy sub-synchronous, synchronous or non-synchronous?
- If the time waveform is collected in acceleration then what is the “g” level?
by Gary James CRL
Proper vibration data collection and diagnostics require knowing the accurate operating (turning speed) of monitored equipment. The most common tools used for measuring equipment turning speed are a tach (tachometer) and strobe (strobe light). If a means to determine equipment speed is unavailable, then an advanced vibration analyzer like VibXpert® may have additional capabilities to help you make a precise determination.
Set your vibration analyzer to acquire a velocity spectrum via the Multimode capabilities. A lower fmax is ideal because that is where the turning speed will be identified. Also, be certain that the lines of resolution (LOR) selected are high enough to accurately measure all of the frequencies around the turning speed. For example, improper LOR selection may result in the driver (motor) and driven (fan, etc.) frequencies being combined/merged together in one peak. This can make operating speed determination inaccurate or impossible. Please note that with higher LOR settings the data will take longer to collect because additional data is being acquired by the vibration analyzer. The number of averages should be set to a minimum of four to make certain any non-periodic energy is filtered out during data collection. Once data collection is complete, a cursor can be placed on the first high peak which usually indicates the turning speed of the asset.
Also, Multimode data collection can be set to a continuous mode allowing the data to be viewed live as it is collected. Once stabilized, the cursor can be placed on the spectrum to determine the turning speed of that asset as described above.
by Mickey Harp CRL
You’ve got it, so why not use it? What am I talking about? Besides your VibXpert® vibration analyzer, you probably have other tools that can be utilized to deliver additional reliability information to your management and facility.
1. Visual inspections can be logged into your vibration routes to help your facility keep on top of a number of things, like:
a. Transformer cleanliness
You can log the transformer as:
- Clean
- Slightly Contaminated
- Dirty–Needs Attention
- Very contaminated – (reduced cooling capacity!)
b. Motor cooling fin cleanliness (same as [a])
c. Plant area cleanliness
- Clean
- Slightly Contaminated
- Dirty–needs attention
- Very contaminated – possible safety hazard
d. Plant area fire equipment condition
- Fire Equipment Ready!
- Hose missing!
1. Valve wrench missing!
2. Nozzle missing! - Extinguisher missing!
e. Record pressure, amperage, megawatts, etc. from gauges.
The list of uses for visual inspections goes on and on. Each inspection can be trended and reported. Many facilities struggle to keep up with some very important equipment or conditions around the plant, because it may not be easily worked into daily routines. If you are already in a routine of collecting vibration data, then you should take advantage of visual inspections. Add all the value you can to your tours through the plant! Find out what the Maintenance Manager or Production Manager might be very interested in knowing on a regular basis and add it to an existing route!
2. Do you have a strobe light? You can use it along with the “Visual Inspection” process spoken of above, and do visual inspections on critical machine couplings even while the machine is in operation. Take great care to remain safe, while getting valuable visual inspection data.
3. Do you have an infrared thermometer gun? If so, you can connect it to your VibXpert to record critical temperatures during a route and trend them. These are just a few suggestions of additional value you may be able to add to your maintenance and reliability efforts from other tools already in your kit and through visual inspections and data-logging activities.
by Mike Fitch CRL
Maintenance departments are often expected to collect data on critical equipment in a consistent manner in order to monitor the efficiency and maximize the life of such equipment. Doing this manually can pose safety or health hazards to those responsible for collecting the data. The solution is to install permanently mounted sensors with wiring directed to a termination/switch box.
There are several ways to permanently mount the sensor to the machinery, but the most common are:
- Adhesive: This consists of using a strong epoxy-like adhesive that will allow for a sturdy mounting. It is very critical that the two surfaces be thoroughly cleaned with a steel wire brush to remove any paint and/or corrosion that can compromise the integrity of the bond between the sensor and the machine.
- Drilling and tapping: This consists of drilling a hole into the casing of the machine and then tapping the hole to the thread of the stud included with the sensor. This last method is the preferred method as it will guarantee a completely solid bond between the sensor and the machine
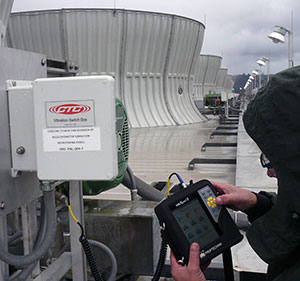
For whichever of the above methods is chosen, cabling will have to be routed. It is important to route the cable through the conduit so that it is protected from harsh temperatures or exposure that can potentially cause damage. When possible, utilizing a cable trough will help keep the cabling organized and away from any of the rotating components of the machine. Labeling the cables will guarantee that the final wiring in the termination/switch box becomes a smooth process. Once the routing of the cable is completed, thanks to the labeling of the cables, the wiring to the termination/switch box becomes very simple. Once the permanently mounted sensors are installed, the analyst in charge of the Condition Monitoring program can safely collect data with the help of a capable data collector such as the VibXpert® II. This will help the plant maintain a world-class reliability and maintenance program while ensuring the safety of its employees.
by Mario Rostran CRL
It is surprising that most users of Condition Monitoring (CM) technologies do not keep their software and/or device firmware updated. Many reasons such as having to pay for updates and support may explain why this happens.
Some of the disadvantages of not keeping your software and firmware updated are:
- You will not receive critical bug fixes. This means living with an annoying problem that may be resolved by simply updating.
- You will not receive feature enhancements. Maybe some of the new features you have requested or new functionality that will allow improvements in job performance is easily available by updating.
- Most vendors do not keep older versions of their software and firmware operational for support. This makes customer support much more difficult for all involved.
Some companies, like LUDECA, do not charge for support or update agreements on the products they provide.
Therefore, it makes even more sense to keep your CM hardware and software updated. Make sure that you keep your contact information updated with your vendor as well. They will wish to notify you when updates are available and can’t if no primary contact information or outdated information is provided.
Latest firmware and software for your LUDECA products.
by Trent Phillips
Some of the best engineers start out as technicians, operators, and mechanics. The reasons should be obvious but are not always understood. These individuals know how to install, operate and maintain equipment. A good manager, engineer, or Condition Monitoring (CM) Analyst should always seek the advice of equipment operators and maintenance employees. The value obtained from a simple conversation can be enormous. They can help with critical things that may otherwise have gone overlooked. This can help improve the design, installation, operation, or maintenance of equipment. The information they are capable of providing but isn’t being exploited may explain why routine reliability problems continue to occur. Never overlook the wealth of information that may be sitting next to you at lunch or working next to you each day!
Watch our Reliability Matters videos
by Trent Phillips