In today’s world, video platform is the way to accomplish effective visual knowledge and a learning mechanism in many organizations. With the use of video, one not only is able to promote products and services but one can also strengthen a culture and demonstrate how-to scenarios easily and quickly.
LUDECA believes in communicating visually to help customers educate and train their personnel on precision skills. For this reason, we are pleased to announce the release of our new microsite www.LudecaVideos.com, which features a Shaft Alignment Know-How series plus a Know-How series for Vibration Analysis and Balancing. The video site features basic terminology, fundamental concepts, advanced measurements as well as product demonstrations. The videos are indexed by category but also searchable by keyword.
We felt there was a need to go back to basics and help educate on precision skills and related technology to improve asset reliability. Following the Uptime Elements™ holistic approach to reliability, alignment and balancing are key components of your asset condition management (ACM) program. We are happy to offer these videos to our customers for their personnel to access and for use in their training programs. We hope this content assists them and others in either improving their reliability program or in getting one started and leads to world-class reliability programs,” —Frank Seidenthal, president of LUDECA.
We encourage you to visit www.LudecaVideos.com and see for yourself the value behind each video.
by Yolanda Lopez
Have you ever been asked “How much longer will it run” or “Can we make our production schedule” or other ‘crystal ball’ type questions? These types of questions can be very difficult or virtually impossible to answer. They often place a reliability professional in a difficult position.
Some future indicators are (or should be) available to the organization that will help you answer the above questions when asked. Four of those indicators are:
- Preventive Maintenance (PM) Completion Rate
Low PM completion rates directly correlate to increased future equipment maintenance work. High PM completion rates mean that needed equipment maintenance is being completed and future maintenance issues will be avoided. - Ready to Work Backlog
This is an indicator of preparedness and efficiency to complete maintenance work. - Outage Schedule Compliance
This is a very important metric to track and is an indicator of future maintenance work. A lack of adherence to outage schedules creates deferred equipment maintenance. This results in increased risks and the likelihood that equipment performance will decrease at a future time, leading to lower capacity, increased downtime, and greater expenses. - Equipment Asset Health Reporting
Proper utilization of condition monitoring technologies like vibration analysis, IR thermography, lubrication analysis, ultrasound, and others are a proactive strategy to ensure that hidden failures become known and corrected before they result in equipment downtime or other unwanted consequences. Tracking these indicators together can provide insights into future asset health. A lot of “red” assets from these technologies will result in future unwanted equipment maintenance and unwanted downtime if corrective action is not taken. Additionally, this can be used to help prioritize equipment maintenance efforts if a good critical equipment ranking system is in place.
by Trent Phillips CRL CMRP - Novelis
Certain technologies have been used for a very long time to identify corrective actions required to keep equipment operational and reliable. Vibration analysis, ultrasonic monitoring, infrared thermography, motor condition evaluation, and lubrication analysis are examples of these technologies. Many terms have been used to describe their usage within a facility. One term often used is “Predictive Maintenance”. Unfortunately, this term can be used in the literal sense with dire consequences.
Many facilities mix all of the required ingredients together to create a successful maintenance and reliability program. Regrettably, many others fail in their efforts. Two of the primary elements for success are predictive maintenance and work execution. The predictive maintenance effort may be quite effective at identifying conditional changes in equipment that should be addressed before functional failures occur. Those efforts will not be fruitful if the results are not executed. The predictive maintenance team has to generate work that is planned, scheduled, and executed. If the results of their efforts are not executed, then the facility will plainly predict costly failures that will be experienced by the facility. Basically, the effort will shift from “Predictive Maintenance” to “Predictive Failures”.
Make sure your facility is not predicting failures. Make certain the results of the predictive maintenance technologies are executed before conditional changes result in equipment failures.
by Trent Phillips CRL CMRP - Novelis
One of the big problems I’ve seen people run into when doing alignments is a lack of repeatability due to high vibration from nearby machinery. It’s obviously pretty difficult to align something that’s moving several thousandths. There are still ways to get accurate readings with some laser alignment tools.
Let’s say you are in the same situation but aligning with dial indicators. The indicator needle is jumping back and forth between 35 and 42. Most likely, you will settle for the average midpoint of 38 or 39. You can do the same with lasers.
The first thing to do would be to switch over to one of the “manual” measure modes (like Multipoint mode) rather than the fully automatic measurement modes (like Continuous Sweep or Pass Mode.) In Multipoint, you can adjust the averaging (sampling time) for each reading and spend a little more time taking each point. A longer sampling time will allow the tool to take much more data at each measurement position and average the data together very accurately, unlike guessing as with the dials. It is also a good idea to take several positions (8 or more) around 360 degrees of rotation. While the minimum required is 5 points over 70 degrees of rotation, the more points and the more rotation you have, the better your results will be. Check your repeatability. If it’s not good, look at your Standard Deviation values. These should be very low. If they’re not, then perhaps your averaging still isn’t set high enough to overcome the surrounding vibration problems. If you can’t get repeatable numbers, spend a little more time taking readings. No one likes chasing their tail making fruitless or inaccurate corrections.
Live move can also run into some problems in high vibration scenarios. Make sure you adjust the averaging value for the Move Function to the same value with which you took successful readings. It may take longer for the results screen to update but will steady the move and greatly improve its accuracy.
The thing to keep in mind is that a good laser alignment system measures down to 1/25,000 of an inch. If the laser is moving, it will affect your readings. Just know how to overcome the problems when you run into them.
We recommend that you take a look at our Alignment Matters Repeatability Video Tutorial
by Tyler Wulterkens CRL
A lot of facilities assign condition monitoring intervals based upon arbitrary schedules such as 30, 90, 180 or 365 days. Often, this is due to a lack of understanding of how equipment fails, misunderstanding of how conditional tasks such as vibration analysis work, available labor, and lack of importance placed upon condition monitoring efforts. These arbitrary collection intervals can actually lead to failures that go undetected and a loss of value from the effort.
To appropriately determine monitoring intervals, a couple of things should be known. First, the point in time (P) that the potential failure becomes detectable must be known (detected with vibration monitoring, for instance.) Second, the time (F) at which the potential failure would degrade to a functional failure must be known. This difference in time (P-F Interval) is the window to take corrective action and avoid the negative consequences of the failure. This difference in time will determine how often conditional tasks such as vibration monitoring must be done to detect potential failures from such things as bearing issues, etc. Typically, the monitoring interval would be set to half of the P-F interval. This allows enough time for the technology to detect the problem and for corrective action to be taken. However, in certain circumstances, it may be necessary to collect data at shorter intervals than half of the P-F interval.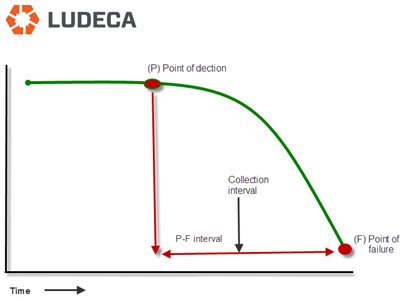
It is important not to assign monitoring intervals based upon gut feelings, arbitrary calendar intervals, and so forth. Let the equipment tell you how often monitoring must be completed. Not understanding the process above can lead to costly results!
by Trent Phillips CRL CMRP - Novelis
The following blog relates to those who field balance using a photo or laser tach and reflective tape.
By far the most common pitfall to field balancing is a problematic tach signal. When one balances a rotor using one’s field balancing unit (VIBXPERT® II, VIBXPERT, or VIBSCANNER®) the equipment is recording the energy displayed at the frequency of the signal from the tachometer. To help visualize the importance of a clear tachometer signal that is exactly 1 pulse per revolution, look at figure 1.
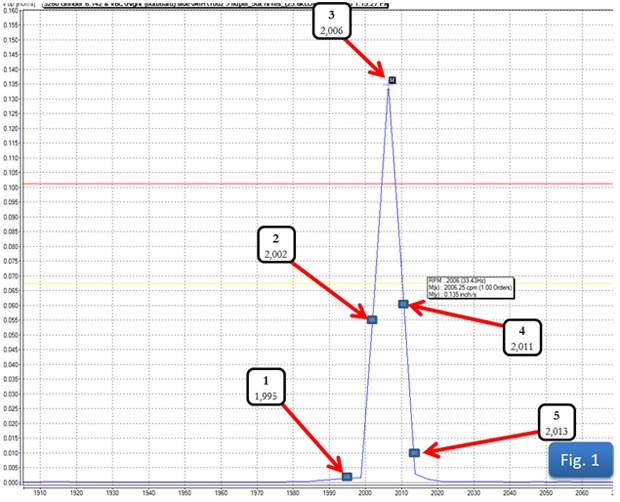
What amplitude will your equipment record if the tach pulses:
1. 1,195 times per minute?
2. 2,002 times per minute?
3. 2,006 times per minute?
4. 2,011 times per minute?
5. 2,013 times per minute?
We often start a balance job by haphazardly placing our tach and tape. Because both the tach and tape are well-engineered, we may go on without a problem. But just a little attention to some of the common tach signal problems is usually all it takes to avoid having to restart a botched attempt at field balancing. What should be avoided when setting up a tachometer?
1. Don’t place your tach too close to the rotor. Most tachometers are used in the fieldwork sending some type of light out and bouncing it back, so they have a sending function and a receiving function. The wavelength of the light is such that not just any light will be accepted by the receiver, but only that wavelength of light sent out by the sending unit. So the receiver counts a pulse every time that wavelength of light appears (or disappears, depending on whether you are triggering by leading or trailing edge). The receiver is no smarter than that, we must supply the rest of the intelligence. When we put the receiver too close to the rotor, even a poor reflector may be able to bounce back enough of the light signal to create a pulse. The balancing technician should determine the distance from the rotor to set up their tach with the understanding that they want a good signal bounced back from their chosen reflector AND ONLY THEIR CHOSEN REFLECTOR! Most often, a 6-inch space is sufficient.
2. Don’t place your tach pointing perpendicular to the rotor. Earlier we stated that “both the tach and tape are well-engineered”. One thing most of us field balancers take for granted is the reflective tape. This tape is actually a well-engineered tool. Reflective tape is faceted in such a way that light can strike it at an acute angle, and still be reflected right back along the axis from which it came. This allows the tach to be staged at such an angle that light will strike the rotor, even a rotor that is itself a good reflector, and be reflected off and away from the receiver UNTIL the tape comes into the line of the light, and then with its special faceting, it will bounce the light back to the receiver. This gives one clean pulse every time the tape comes around, and only when the tape comes around.
3. Don’t use old reflective tape that may not be in proper working condition. Make sure the tape is clean and in good shape. Reflective tape works very well when it is clean and in like-new condition, but can get dirty or even deteriorate if conditions are right. Replacing a small piece of tape is most often very quick, easy, and cheap compared to extra balancing runs or possibly even worse.
4. Don’t use a tach with dirty lenses. Make sure the tach lenses are clean and in good shape. When your lens is dirty, it forces you to do things (in order to get a strong enough signal to go through the dirty lens) that aren’t conducive to a clean, clear, once per revolution pulse; like move the tach too close to the rotor, or place it at a 90° angle to the rotor.
Doing everything we have suggested here could take all of 5 minutes (if you work slowly) at the beginning of a field balance job, but it could save a lot!
by Mike Fitch CRL
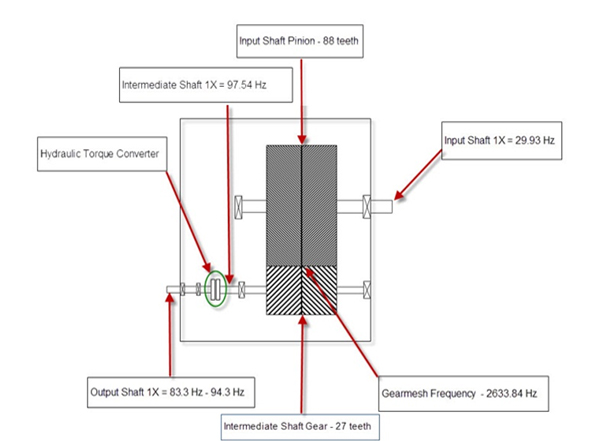
Recently, while assisting a customer in setting up a vibration database, the subject of creating the best trending template for a boiler feed water gearbox came up. This particular application requires trending templates to monitor a complex machine train consisting of four separate machines. For the purpose of this discussion, we’ll concentrate only on the gearbox in the machine train. The gearbox is a speed increaser. It is a little unusual in that a hydraulic torque converter allows the speed of the main boiler feedwater pump to be varied. This gearbox is designed with three individual shafts (an input shaft, intermediate shaft and output shaft), all enclosed within a single gearbox housing.
The speed of the input shaft is constant at 29.93 Hz (1796 rpm) and attached to this input shaft is a pinion gear with 88 teeth. The pinion gear runs in mesh with another gear mounted on the intermediate shaft with 27 teeth. This results in a gear mesh frequency of 2,633.84 Hz. We must determine the required frequency range (Fmax) by multiplying our calculated gear mesh frequency by 3.25 resulting in a Fmax of 8559.98 Hz. In the software, we can’t select 8559 Hz so we’ll need to select the next higher value, 10kHz.
The next step in the process is to determine the speed of the intermediate shaft by using the following formula:
Intermediate shaft speed = 29.93 Hz × 88 teeth = 2,633.84 Hz / 27 teeth = 97.54 Hz or 5,852.4 rpm.
We must now determine the required lines of resolution (LOR) since we have two fairly closely spaced running speeds. We have the intermediate shaft speed, running at a constant speed of 97.54 Hz and the output shaft speed which is variable.
When the boiler feedwater pump is operated at 100% the output shaft running speed of the gearbox is 94.33 Hz or 5660 rpm. There are only 3.21 Hz or 192.6 CPM between the two shaft speeds within the gearbox. Therefore, our lines of resolution setting will need to be high enough to provide separation while performing analysis. With a Fmax setting of 10kHz, we will need a minimum of 3200 lines of resolution to distinguish between the two shaft speeds. 10kHz Fmax / 3200 LOR = 3.125 Hz bin width, but to be on the safe side I would recommend selecting the next higher resolution setting (6400 LOR). This will provide a 1.56 Hz (96.3 CPM) resolution to easily see the two different shaft running speeds for accurate analysis.
Below is an example of improper resolution for accurate analysis:
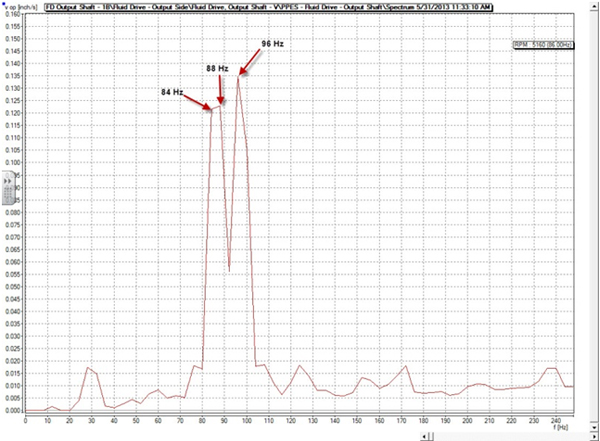
Improper resolution settings resulting in a flat top 1× for the output shaft speed. Proper resolution settings: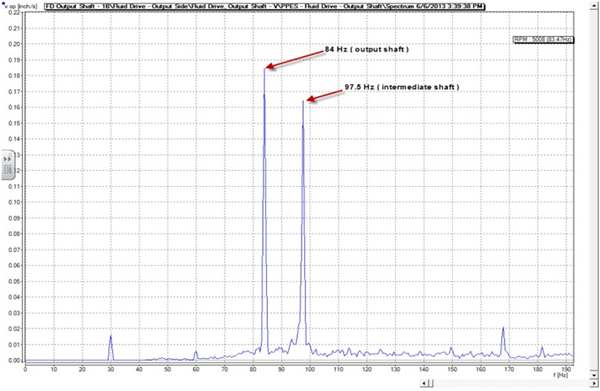
Correct resolution settings allowing clear distinction of the output shaft speed.
The lesson here is that proper vibration analysis requires understanding the machine design. Additionally, it is critical that the proper maximum frequency (Fmax) and lines of resolution (LOR) be determined. Improper Fmax settings will result in data being missed. Inadequate lines of resolution (LOR) can cause closely spaced peaks to merge together making it impossible to distinguish between them. These errors will result in poor vibration analysis results. Pay close attention to the details when setting up the equipment in your vibration database.
by Dave Leach CRL CMRT CMRP
Grease, excess paint, etc. can affect the quality of collected vibration data. The below 3 steps will ensure that the best possible data quality is always collected:
- Always carry a rag, scraper, brush, etc. to clean each measurement location before acquiring vibration data.
- Make sure that the measurement surface is flat and the sensor is not rocking during data collection.
- Hold the cable during data acquisition to prevent movement that may induce electrical noise and affect measurement quality.
Learn about the Triboelectric effect on vibration accelerometers
by Trent Phillips CRL CMRP - Novelis
Equipment is being built lighter and cheaper. This means that resonance has become more of a reliability problem with the equipment. Most engineers, CM analysts, mechanics, and managers are not aware of how resonance may be affecting their equipment. Resonance frequencies will excite any vibration occurring at or near the same frequency. This can include misalignment, unbalance, bearing faults, or other defect frequencies. This will cause your equipment to fail more quickly as well as other unwanted effects.
You should be aware of and document the resonance frequencies affecting your equipment. Many methods can be used to determine the resonance frequencies in your equipment and a good vibration analyzer will have the resources to help you do so. Methods such as an impact test (bump test), negative averaging, startup, coast down, etc. can be used to identify resonance frequencies. Additionally, the vibration analyst should look for signs of resonance-related issues when doing routine equipment analysis. For example, always look at the amplitude ratios between horizontal and vertical vibration measurements. Ratios of 3 to 1 or higher (horizontal versus vertical) are an indication of resonance issues in the equipment being monitored.
What should you do once a resonance problem is known and the unwanted reliability consequences understood? It is important to keep equipment operational speeds away from these critical frequencies by at least 20-30 percent. Actions can be taken to shift these critical frequencies and minimize and/or eliminate their negative effect on your equipment reliability. The primary methods are:
- Add Mass: Adding mass will lower the resonant frequency.
- Add Stiffness: Adding stiffness raises the resonant frequency.
- Damping: Dampens the vibration to keep it from becoming a destructive force
Make sure you understand the consequences that resonance has on your equipment. Not understanding and addressing equipment resonance will lead to unwanted and costly reliability issues.
by Trent Phillips
Equipment vibration levels and bearing life are directly correlated. Many studies have established this link. Increased vibration levels due to misalignment, unbalance, looseness and other factors will greatly reduce the life span of bearings and other critical components within your equipment. It is not the amount of vibration that affects bearing life, but the forces that cause this vibration. These dynamic forces are propagated into components like bearings, reducing their life span. Reducing vibration levels means that the forcing functions are reduced/eliminated and bearing life is improved as a result.
Reducing vibration levels in your equipment will decrease the maintenance efforts required to keep it running, improve uptime and save your company money. These savings can be used to help justify your condition monitoring and reliability efforts as well.
Eliminate vibration before it kills your equipment, production, and profits.
by Trent Phillips
PUMPS & SYSTEMS • September 2014
Revisiting the fundamentals of data examination, time and resolution can solve equipment issues before they happen.
Inexperienced vibration analysts encounter a common problem: They are often expected to learn too much, too fast. Instead of taking time to appropriately understand the basics, new analysts must often move directly to a busy schedule of collection and analysis without many apprenticeships. Training is almost always in a group setting, and instructors often move too quickly through the material. The facts are learned well enough for an analyst-level exam, but an in-depth understanding is often taken for granted.
Accurate vibration analysis requires complete clarity on foundational subjects. Real-world applications demand more of young analysts than what they can learn in group training. Facility operations depend on a whole picture of how their equipment moves and where energy is used—and lost.
Read my entire article The Basics of Spectral Resolution for Motor Vibration Analysis
by Mike Fitch CRL
There are two primary types of accelerometers: one is the ICP (integrated circuit piezoelectric) having voltage output, and the other is known as a CLD (current line drive) type, with a current output. The standard ICP accelerometer has a nominal output of 100 mv/g and the output of a standard CLD accelerometer is 9.81µA/g.
Cable movement during low-frequency measurements with ICP accelerometers can induce triboelectric noise.
Triboelectric noise results when two materials are rubbed together creating an electrical charge between them. Triboelectric noise can be generated by flexing or vibrating the accelerometer cable during data acquisition. Such movement can result in friction between the cable’s various conductors, insulation, and fillers. This friction can generate a surface charge resulting in triboelectric noise. Vibration data collectors will measure the voltage generated by this effect. This can cause data integrity issues with acquired data. CLD sensors output current rather than voltage and are therefore not subject to the triboelectric effect from cable movement.
by Gary James CRL
Recently I visited a customer’s facility to provide onsite training for the VibXpert® vibration data analyzer they had recently purchased. Before we could get started collecting data, we needed to build the equipment hierarchy and measurement templates required. Once the database was created, we loaded routes into the VibXpert and proceeded to collect vibration data.
The first room we entered had two large belt-driven overhung fans. At first glance, it was obvious that one of the fans was running extremely rough. We collected vibration data on both fans and paused to review the results. We noticed that the 1× amplitude on the rough fan was over 1.0 inches per second peek. The local CM technician immediately commented that the fan should be balanced and his observation was correct when simply looking at the vibration data.
The room was full of clues that explained the cause of the fan unbalance. This facility processed and manufactured wood products. Large amounts of wood dust are produced and these fans were designed to ventilate a high dust area. Everything in the room was covered with wood particles and dust. The only question was how much had accumulated on the inside of these fans.
I asked if the fan could be stopped for a short period and the inspection door opened. My request was honored and the fan was shut down and locked out. Our examination revealed the fan blades had amassed substantial amounts of wood particles. The fan blades were cleaned and resulting in a pile of wood chips weighing about 5 lbs. The fan was placed back into operation and allowed to run for several minutes. Vibration data was recollected on the fan and the 1× amplitude had reduced to 0.1 inches per second.
Fans require corrective action to eliminate unbalance conditions from time to time. However, the cause of unbalance may simply be a buildup of foreign matter on the blades. This fan was being allowed to beat itself to death due to product buildup. This facility learned a few lessons from the experience. First, inspections utilizing the human senses (touch, hearing, etc) could have been used to determine that this fan was in need of attention.
Second, periodic vibration monitoring would have identified a need for maintenance on this fan. Third, if a fan is properly balanced, simply cleaning foreign matter buildup may reduce the vibration, prevent equipment damage and maintain the reliability of the equipment. Make sure that you utilize these three steps during your daily maintenance efforts on equipment.
by Dave Leach CRL CMRT CMRP
Advanced vibration analyzers like the VibXpert® have powerful analytical features that often go underutilized. One such feature is the ability to acquire continuous (live) vibration measurements. This can be utilized to check for measurement signal stability and quality. However, it can also be used for additional analytical troubleshooting as well. Continuous (live) vibration data can be used to determine if electrical energy (faults, etc.) is present in electrical motors. Set your vibration analyzer to continuous monitoring. Identify and watch the peaks in question.
Turn the motor off while watching the peak(s) in the measured data. Peak(s) that disappear immediately when motor power is turned off are related to electrical energy. The remaining vibration data is associated with rotating components within the equipment.
Continuous data collection can be activated in the VibXpert analyzer by selecting the Multi-Mode icon and then the Data Collection icon that will be used. Press the Menu key, select the display setup option and toggle continuous measurement to “Yes” (it is set to “No” by default). Alternatively, you can activate the live mode by keeping the “Enter” key pressed when the measurement starts. The actual data collection begins when you release the “Enter” key.
by Mickey Harp CRL
Guest post by Brad Loucks, Mechanical Engineer at Pioneer Engineering
In a condition monitoring vibration program, determining the appropriate intervals of data collection is just as important as the data that is being analyzed. Properly scheduled data collection intervals of equipment provide data analysts with a better picture of how equipment is performing over a period of time. Having a history of data is important for an effective condition monitoring vibration program and this is done by establishing correct data collection intervals.
Data collection intervals should be established and executed with purpose, not done randomly. To establish intervals, it is important to know and understand how the equipment works. Determining the appropriate time interval between collections is done by identifying how often the equipment runs, how fast it runs, and the application. The calculations are based on the estimated life cycle of the bearings but also the estimated amount of time it takes to go from a defect to a complete failure.
Collection intervals should be a routine function. Many times data collection falls behind because the collection person is too busy to collect the data. One of the most common issues that I have come across is that plants will begin to collect data and then the person collecting the data gets pulled to do other work and the data collection gets missed and becomes more random. This is a slippery slope in that it almost always leads to the data no longer being collected. Then when an emergency comes up such as a bad-sounding machine, the analysis has not been collecting history on the equipment but they have also been out of the analysis for so long that they have a difficult time remembering how to analyze. The history and interval are just as important for proper analysis as it helps to give the analyst a more accurate analysis by allowing them to see the progression timeline.
Bearings often do not fail in a predictable time span. If this were the case, vibration analysis could be overlooked and time-based maintenance could be used. A bearing can go from a known defect to catastrophic failure over the course of a few years or it can happen within minutes. The collection intervals are calculated so that not only can data be collected and the severe defects be identified, but also to identify when a defect has formed and allowed for a history to be built in order to watch the progression of the defect. This can aid in determining whether immediate action should be taken or if the defect is at an early enough stage where proper planning and measures can be taken to avoid an immediate shutdown and loss of production.
If the equipment is deemed valuable enough or if unplanned downtime is just out of the question, then calculated collection intervals are a necessity of a proper condition monitoring vibration program. Through proper maintenance, a condition monitoring vibration program can save a plant both time and money in reducing or eliminating unplanned downtime, as well as significantly reduce the possibility of injury or death of plant staff due to catastrophic equipment failure.
by Ana Maria Delgado, CRL
Guest post by Ray DeHerrera, Mechanical Engineer at Pioneer Engineering
Vibration analysts use multiple tools to predict a potential fault in a machine; from transducers to accelerometers, the toolbox for vibration analysts is continually expanding to allow for more comprehensive and accurate data collection and interpretation. One tool that is absolutely important to the data analysis process is knowing how your equipment processes data. Vibration analysts need to know how results are being derived from multiple calculations within your equipment. This allows for the development of an efficient collection history that will produce more accurate results.
The calculations attempt to translate data banks into a model that can then explain the events occurring inside of your equipment. Often times the computer-processed model may develop imaginary information, thus leading to more questions than answers. With basic background and knowledge of variables that may affect your post-processed data, your questions will start to be answered.
To introduce the initial creation of our mathematical model that is displayed upon our data collector or computer screen, (such as the time waveform or spectrum) we will explore commonly used hardware such as the transducer. In general, the function of the transducer is to convert one form of energy into another. A commonly used transducer for case-mounted readings is an accelerometer. The accelerometer mimics mechanical vibrations to produce a usable signal. The usable signal is so small that typically an internal amplifier will be needed for your data collector to harness the information. This process is the initial creation of our mathematical model of data, which has been created from a response of a mechanical device (transducer) sitting upon a machine and is now being converted to a digital signal that has been amplified.
Now our signal must be stored for further analysis. There are a number of vibration collector types and manufacturers. The collector is very similar to a computer giving it the ability to quickly process the original signal into various mathematical models. One must take the time to do their research before purchasing a collector and the associated software. Many desired post-processing and collection capabilities may be limited such as sampling rates. With a good collector and setup, your mathematical models will be accurate. The accuracy and consistency in your collections are key when managing your periodic collections.
The basic knowledge of how your equipment generates your post-processed model will make your time more efficient and your results accurate. The analyst will be able to identify data that is imaginary and pick out what is real. Take the time to understand your hardware and how your computer generates each model.
by Ana Maria Delgado, CRL
Have you ever collected data and uploaded the data back into OMNITREND® only to realize that you have duplicate data in your database? As a technician, you are pressed for time and your boss needs that report like yesterday. Every so often, when uploading the data you can get distracted by other people or from trying to juggle too many things at once, and you inadvertently upload the data twice.
You can delete the duplicated data without having to delete each one by one! Here’s how:
• Click Tools
• Select Report
• Select OMNITREND Web
• Click OK
• Click Database
• Select Database Utilities
• Select Data cleanup
• Once the data cleanup is complete click Close
• In OMNITREND click Database
• Select Database Utilities
• Select Compact & Repair
Once the Compact & Repair process is complete you can go into Machinery Manager, drill down into your database, select the task and then click the Edit Meas. Data tab on the right-hand side of the screen, and you will notice the duplicate data has been deleted.
by Myrna Michel
For the highest confidence level possible while doing predictive vibration analysis work, the location and placement of your sensor are crucially important to you. However, sensor placement is sometimes a trade-off between time, safety, and precision.
Most equipment is mounted with the shaft oriented horizontally to the ground and the analyst must decide whether to take a radial horizontal measurement, radial vertical measurement, a shaft axial measurement, or some combination of the three. If the analyst has the time, there is good reason to take all three positions. When it comes to analysis, an analyst can always choose not to view data he or she has, but can never choose to view data he or she did not collect.
Where should I place my sensor? The answer to this question should come from a focused consideration of what each possible position offers to the overall analysis effort. The fundamental consideration in placing your sensor is that the vibration signal from the component or components of interest should take the path of least resistance to the sensor. This should be coupled with thought given to how every likely defect frequency presents itself relative to direction.
Many fault diagnoses are determined, or the level of confidence enhanced, by relating one location result to another. For example, a high 1× vibration in the horizontal direction on a direct drive center-hung rotor could mean a lot of things, if taken by itself. But if this information is coupled with the additional hypothetical data below:
- The axial vibration is also high: then possible misalignment or bent shaft becomes likelier.
- The axial is low, but the vertical is 1-½ times as high as the horizontal: Now looseness is probable.
- The axial is low, and the vertical is ½ of the horizontal: probable unbalance.
- The axial and vertical are both very low relative to the horizontal: In fact, the horizontal is 75 to 100 times the axial and vertical! Almost unquestionably there is a resonance problem.
In all of the above scenarios, a phase and visual inspection are required to deliver a truly confident diagnosis, but the directional aspect of data analysis is clearly shown.
Trending puts still further demands on the analyst by requiring each successive measurement to be taken in exactly the same place as before, to the extent possible. For parameters to be reliably trendable, operating states and data collection states need to be the same from measurement to measurement.
A real danger for the analyst using portable vibration data collectors lies in the monotonous repetition of placing a sensor hundreds of times in a day of data gathering and becoming careless when making that next placement. If feasible, routes should be kept small enough to help avoid the human factor. It’s too easy to daydream while collecting data. A route under 200 points helps keep the monotony away. The analyst should focus on both safety and data collection precision throughout each route. Happy defect hunting!
by Mike Fitch CRL
The scenario: You have just been informed that a corporate reliability initiative has begun. Your new assignment is to implement a vibration analysis program. You are disconcerted because you are not sure how to implement this new assignment or where to seek help. Many organizations implement a reliability initiative because their competition has already done so or management has become convinced of the financial value that can be gained from it. Unfortunately, as with most things in life, the devil is always in the details.
Company culture plays a critical role in the successful implementation of a reliability program. This shouldn’t be underestimated. Some companies implement program after program, each with the best of intentions. The objectives are always to increase operating efficiencies, achieve cost reductions, capacity improvements, shrink required manpower, etc. Many of these efforts fail after a few months because the program is replaced by something new, key management individuals did not support it, inadequate funding was provided, proper awareness was not instilled, and many other reasons. The new initiative falls into an abyss and is quickly forgotten.
Most seasoned employees who work in these organizations have seen this happen time after time over their careers.
Many employees and managers thus adopt a “wait and see” approach. This trait is learned after years of seeing efforts start and quickly fail. Why join the “flavor of the month” club and devote focus to something that will soon be replaced? It requires less energy to wait and see if the new program will remain a company priority and become successful. The financial value to your business is clear, but will only be realized if the program is correctly implemented and sustained. Senior management has to ensure that everyone understands this effort is not a passing fad. Key signs of support must be given with results-driven implementation.
Don’t let the vibration analysis program and other reliability efforts become a “flavor of the month” effort.
Become the champion that promotes the value of these efforts and helps to ensure the results are implemented.
Doing so can reap great rewards for yourself and pay great dividends for your company. Seek support and advice from technology vendors, co-workers, and the many resources available. You are not alone! Many individuals have been where they are now or faced the same challenges within their organization.
The road to success can be long and difficult to traverse. However, with proper implementation, persistence, and senior management support you can get there. Persevere!
by Dave Leach CRL CMRT CMRP
New portable and online-monitoring systems help extend the value of vibration monitoring into the heaviest of industrial operations. Here’s a look at how users avoided serious motor failure in mining and detected a critical bearing failure in paper-pulp production by using the right vibration products at the right moment.
Case Study #1:
A Phosphate mine is garnering big returns by monitoring numerous pieces of processing equipment with online solutions from LUDECA. The mills use several low-cost VIBNODE® online systems. The VIBNODE is a comprehensive entry-level online monitoring system that allows the end-user to access customized spectrums and time waveforms from a remote location. The system will notify the end-user via email or text message when the vibration level exceeds an alarm band.
The new monitoring system has helped the mine’s vibration group catch several problems with a newly rebuilt drive motor. The waveform showed a fuzzy amplitude modulation that increased and decreased with every RPM.
A look at the acceleration spectrum indicated a large amount of high-frequency noise well over 1g. Upon inspection, several internal retaining bolts were found to be backing out and contacting the frame of the motor rotor. The bolts were tightened to torque specifications, which was believed to have solved the problem. A week later, however, the problem reemerged as the bolts had once again backed out and began to rub. The bolts were again torqued to specification, but this time with an application of thread locker, which held the bolts in place.
Had this problem not been identified by the fuzzy waveform and a high-frequency acceleration band alarm from the VIBNODE system, the errant bolts would have quickly eaten into the motor rotor and caused a catastrophic motor failure. The motor rebuild or replacement is valued at well over $100,000. And losses to production would have been many more times this amount.
Case Study #2:
Low-speed equipment turning below 40 RPM is often difficult to analyze because of the low energy it produces. If there is not much energy, there is often not much to see. For this reason, the dynamic range of a vibration analyzer/data collector and its signal-processing quality become critical for low-speed machine analysis. Recently, a pulp mill using a VIBXPERT analyzer from Ludeca took a spectrum and time waveform on a slow-speed 35 RPM roll. The VIBXPERT is a portable, lightweight, 2-channel, FFT data collector/vibration analyzer for monitoring and diagnosis of machine conditions. As a data collector, VIBXPERT records all forms of machine vibrations, bearing conditions, process data, and visual-inspection information.
Because of the dynamic range of the VIBXPERT, the mill’s maintenance technicians were able to see a repeating pattern in the time waveform. The recurring pattern was present for every RPM and would increase slightly, then disappear for about three-quarters of the roll’s revolution. A delta cursor was placed on the repeating pattern and the source frequency was 420 CPM. This worked out to be the frequency of the inner race. A 25,000-line spectrum was also collected with a bandwidth of 7.5 CPM per line of resolution. The amplitude was very low below 0.0008 inches per second, yet a definite harmonic pattern appeared. The main harmonic pattern was at 420 CPM, with each peak having another underlying pattern of 35 CPM sidebands. The frequencies represented the inner race and roll RPM. Had this data been taken using a conventional spectrum with a resolution of 6400 lines or even 12,800 lines, this low-frequency/low-energy event would have looked like a spectrum ski slope and been ignored.
Upon removal of the bearing, a crack in the inner race was plainly visible. There was evidence the inner race had begun to walk around the shaft. If the bearing had been left in service it would have damaged the shaft and required that both the shaft and bearing be replaced. Instead, only a minimal two-hour shutdown was required to replace the bearing. Thanks to early detection, the cost of replacing a roll was averted, as well as saving the eight or more hours of lost production that a roll replacement would have required.
by Greg Lee