As a vibration monitoring program becomes more mature, the number of monitoring points on a machine and throughout a facility can increase to a very high number. These additional monitoring points are required to identify potential failures and maintain a world-class reliability program. Unfortunately, these additional measurement points usually result in an increase in the time required to complete the data acquisition (routes).
Consider using a triaxial accelerometer with a magnetic base along with a vibration analyzer such as the VibXpert® II. This combination will allow the acquisition of multiple measurement points simultaneously and guarantee that proper data is being collected. You will be able to achieve the desired results with the highest analytical accuracy and greatest labor efficiency.
by Mario Rostran CRL
Proper vibration data collection and diagnostics require knowing the accurate operating (turning speed) of monitored equipment. The most common tools used for measuring equipment turning speed are a tach (tachometer) and strobe (strobe light). If a means to determine equipment speed is unavailable, then an advanced vibration analyzer like VibXpert® may have additional capabilities to help you make a precise determination.
Set your vibration analyzer to acquire a velocity spectrum via the Multimode capabilities. A lower fmax is ideal because that is where the turning speed will be identified. Also, be certain that the lines of resolution (LOR) selected are high enough to accurately measure all of the frequencies around the turning speed. For example, improper LOR selection may result in the driver (motor) and driven (fan, etc.) frequencies being combined/merged together in one peak. This can make operating speed determination inaccurate or impossible. Please note that with higher LOR settings the data will take longer to collect because additional data is being acquired by the vibration analyzer. The number of averages should be set to a minimum of four to make certain any non-periodic energy is filtered out during data collection. Once data collection is complete, a cursor can be placed on the first high peak which usually indicates the turning speed of the asset.
Also, Multimode data collection can be set to a continuous mode allowing the data to be viewed live as it is collected. Once stabilized, the cursor can be placed on the spectrum to determine the turning speed of that asset as described above.
by Mickey Harp CRL
Maintenance departments are often expected to collect data on critical equipment in a consistent manner in order to monitor the efficiency and maximize the life of such equipment. Doing this manually can pose safety or health hazards to those responsible for collecting the data. The solution is to install permanently mounted sensors with wiring directed to a termination/switch box.
There are several ways to permanently mount the sensor to the machinery, but the most common are:
- Adhesive: This consists of using a strong epoxy-like adhesive that will allow for a sturdy mounting. It is very critical that the two surfaces be thoroughly cleaned with a steel wire brush to remove any paint and/or corrosion that can compromise the integrity of the bond between the sensor and the machine.
- Drilling and tapping: This consists of drilling a hole into the casing of the machine and then tapping the hole to the thread of the stud included with the sensor. This last method is the preferred method as it will guarantee a completely solid bond between the sensor and the machine
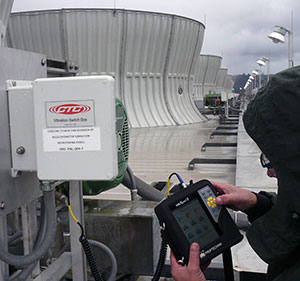
For whichever of the above methods is chosen, cabling will have to be routed. It is important to route the cable through the conduit so that it is protected from harsh temperatures or exposure that can potentially cause damage. When possible, utilizing a cable trough will help keep the cabling organized and away from any of the rotating components of the machine. Labeling the cables will guarantee that the final wiring in the termination/switch box becomes a smooth process. Once the routing of the cable is completed, thanks to the labeling of the cables, the wiring to the termination/switch box becomes very simple. Once the permanently mounted sensors are installed, the analyst in charge of the Condition Monitoring program can safely collect data with the help of a capable data collector such as the VibXpert® II. This will help the plant maintain a world-class reliability and maintenance program while ensuring the safety of its employees.
by Mario Rostran CRL
Vibration analysis can detect the following bearing fault conditions:
- Defects on raceways
- Defects on rolling elements
- Defects in cage
- Looseness in housing
- Excessive clearances
- Bearing turning on the shaft
- Misaligned bearing
- Cocked bearing
- Lack of lubrication
by Trent Phillips
Have you considered the costs associated with allowing your equipment to continue operating at excessive vibration levels? Have you considered the benefits of reducing the vibration levels of your equipment? The reliability and cost benefits of reducing the vibration levels of your equipment may surprise you.
Below are some examples showing the estimated increase in bearing life attainable by reducing the overall vibration levels in equipment.
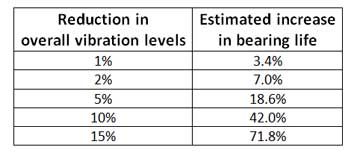
Do not deny your facility the increased equipment reliability and decreased maintenance cost associated with reductions in vibration levels.
by Trent Phillips
Alarms can save time and assist in the notification of impending issues when analyzing vibration data within your Condition Monitoring software. Of course, the correct alarms must be set in order for the analyst to perform his or her job correctly. Too many times the incorrect levels are set for alarms causing a machine to either be constantly in alarm or for the monitored conditions never to reach the required levels to alert the analyst of an issue that should be alerted.
OMNITREND® software has many different alarms that can be configured to assist the analyst in performing their job. Over time the running condition of a machine will change and it is important to make certain that the alarms are also checked and tweaked if needed. An alarm value might need to be changed many times over the life of a machine.
OMNITREND has a feature that allows the end-user to view the collected data and adjust or set alarms according to the machines’ vibration levels. These “smart alarms” should be set after collecting data for at least three months. The three-month period allows the analyst to view how that machine has operated over that time period.
The ability to display many different data readings at once on the same screen is provided. This allows for smart alarms to be configured using the vibration levels from the machine. Do remember that a machine’s vibration signature will change over time. Be certain to update your alarms with that information in mind.
If you have any questions or need assistance configuring alarms within OMNITREND please contact us. Our hardware and software support is offered at no charge to our valued customers.
by Mickey Harp CRL
What are some of the most common techniques that should be used every day in a vibration analysis program?
-
Spectrum Analysis
Spectrum Analysis is used to help identify the normal operating frequencies of a machine. Additionally, the defect frequencies and their characteristics can be routinely identified.
-
Waveform Analysis
Waveforms are one of the most overlook analysis tools. Waveforms can be used to identify fault patterns of equipment defects and help determine the severity of the defect.
-
Trend Analysis
Trend Analysis is a critical part of any vibration analysis or condition monitoring program. Trend analysis will help identify fault trends in equipment that may have gone unnoticed otherwise. Also, trend analysis can be used to help identify the severity and rate of progression of identified fault conditions.
-
Band Alarming
Carving up the entire spectral range into significant bands and setting alarms to indicate when a problem might be beginning is a good way to optimize the time of analysts and the efficiency of a vibration analysis program. This method can prevent fault conditions from being overlooked.
-
Shock Pulse
Shock Pulse is a way of harnessing the resonant properties of sensors to gain valuable defect information. This method can be used for early warning of bearing defects and to identify lubrication-related issues.
-
Envelope Demodulation
Enveloping is a generally valuable early detection method for anti-friction bearing defects and specifically very valuable for detecting such flaws in low and very low-speed equipment.
-
Phase Analysis
Phase analysis can be incorporated into everyday route data collection. This data can be used to distinguish between different faults that may have similar characteristics.
by Trent Phillips
Have you ever been notified by operations that a machine is experiencing an issue and asked to quickly help determine the nature of the problem? Does this happen repeatedly on the same machine? Even around the same time of day or week?
Have you considered that process changes could be affecting the equipment? Changes in flow rate, operational speed, temperatures, etc. can affect the normal operation of a machine. The effects can be increases in vibration levels, failures, etc.
Operators may be changing the operational parameters of a machine or process at the start of a shift or at certain times. These changes could be affecting the ability of the machine to operate normally. This could explain why the machine is experiencing problems and why the problems occur at certain times of the day or week.
Some studies have revealed that between 60% – 70% of equipment failures are preventable by operators.
Operational parameters should always be monitored and considered as possible causes for equipment issues.
by Trent Phillips
UPTIME • December 2013/January 2014
AES Southland provides power to Southern California from a multitude of power resources. In 1998, AES Southland acquired the Alamitos natural gas power plant from Southern California Edison. Since that time, AES has undertaken a number of programs to modernize the generating station and improve the reliability of the Alamitos facility.
In 2010, AES Alamitos’ Units 3 & 4 boiler circulating pumps and Units 5 & 6 exciters were identified as having reliability issues. These machines were never equipped with vibration probes and only the metal temperatures of the exciter pedestal bearing and common lube oil drains were monitored by the control room recorders. Due to the low cost of implementation and OMNITREND® software compatibility, it was decided to purchase and install a VIBNODE® monitoring system to improve the reliability of the AES Alamitos Units 3 & 4 boiler circulating pumps and the Units 5 & 6 exciters.
Download the entire article RETROFIT MONITORING WITH BIG PAYOFF RESULTS by Jim Cerda and Greg Lee.
by Greg Lee
Vibration data collection on plant equipment can be very problematic due to safety concerns, time constraints, access difficulties, and other reasons.
Solution: The use of a termination switch box and vibration sensors can allow an analyst to safely collect vibration data away from conditions that could complicate or even prevent manual readings from being taken due to safety concerns or other reasons. In addition, this can speed the data collection process and increase time efficiency within the Condition Monitoring (CM) program. A capable data collector such as the VibXpert® II allows a CM program to collect data remotely using methods like the one described above. This capability can greatly enhance safety and efficiency within your CM program.
by Mario Rostran CRL
The Finger as a Sensor and Other Things That Are Of Utmost Importance!
Toyota did a study to find out why some equipment failed prematurely. They found that something like 80% of premature equipment failures could all be traced to three rather simple causes; causes that could have been prevented or remediated before they led to equipment breakdown. What were the three culprits?
a. Looseness
b. Improper Lubrication
c. Contamination
All three of these can be addressed by the vibration analyst during collection and analysis.
Looseness can be detected with a vibration analyzer. When you see looseness, use your finger as a sensor and run it around the interfaces of the bearing pedestals, housings, and foundations. It is surprising how sensitive one can be to the phase difference of shaking parts that have become loose. See that it is remedied before it causes catastrophic failure.
Inadequate lubrication can be detected by Shock Pulse. If you are taking high-frequency acceleration readings it will cause a raised noise floor. This one is best avoided altogether by a well-planned and supported lubrication program. Often, by the time-poor lubrication is detected, a considerable amount of damage has already been done. An electric motor’s winding insulation breakdown rate is doubled for every 18° F rise over 165° F. This is why motor cooling fins are actually for cooling and not for holding dust, grime, or whatever. Contamination is an important condition to monitor via a manual input point for each machine area. Add it to your route. Report equipment covered in whatever foreign matter your plant has lots of so it can be properly cleaned before damage is created.
Focusing attention on the three areas above will definitely create value for your company.
by Mike Fitch CRL
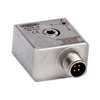 Triax transducers have three sensors within a single housing measuring all three vibration axes (X, Y, and Z). There is an argument in favor of mounting a Triax sensor in the middle of a motor, asserting that it can provide all of the necessary data for defect analysis. Triax sensors are also beneficial when collecting large amounts of either Modal or Operational Deflection Shape (ODS) data. A special impact hammer can be used to measure all three axes of vibration data for Modal analysis, minimizing the number of impacts and effort required to collect this type of data.
However, certain disadvantages are associated with Triax sensors that also should be taken into consideration. For example, some defects can be missed until very late in the failure mode when the sensor is used at a single sensor location. This can reduce the amount of time available to take corrective action on the equipment being monitored. Triax sensors can be quite expensive when compared to standard vibration sensors. Additionally, the data collector being used must have the electronic capabilities to utilize these types of sensors.
by Gary James CRL
For many vibration analysts, a magnet is the point of contact between them, with all of their sophisticated technology, and the rotating equipment they wish to monitor. This being the case, the magnet and its mounting characteristics occupy a very important position in the scheme of what they do every day, yet this crucial part of their occupation is most often taken for granted.
Check your magnets frequently! Make sure the sensor is securely bonded to the magnet so the least possible interface loss is experienced. If you have to help hold the magnet and sensor onto the equipment, it’s time to get a new magnet. The magnet should be strong enough to support the weight of your cable assembly without rocking at all when the cable is swinging. When your sensor and magnet are not in use, make sure the magnet has something to pull against like a washer or what many analysts have found to be very useful for magnet storage… the side of a metal file cabinet.
by Mike Fitch CRL
Cross channel phase is a process of using a two-channel instrument to determine the phase relationship between two measurement locations without using a fixed reference tachometer. The cross channel phase uses two-time waveform signals: Using channel “A” as a reference it takes one cycle in the time waveform as one revolution of the shaft and plots the “B” channel time waveform against channel “A” to determine the relative phase. This process is useful for confirming angular or offset misalignment, unbalance, loose parts, and problems such as soft foot (machine frame distortion), etc.
Cross channel phase cannot be used for performing a dynamic balance on a rotating component as it refers to the relative phase while dynamic balancing requires absolute phase data.
by Gary James CRL
To appropriately determine monitoring intervals a couple of things must be known. First, the point in time (P) that the potential failure becomes detectible must be known (detected with vibration monitoring, etc.). Second, the time (F) at which the potential failure would degrade to a functional failure must be known. This difference in time (P-F Interval) is the window to take corrective action and avoid the negative consequences of the failure. This difference in time will determine how often conditional tasks such as vibration monitoring must be done to detect potential failures such as bearing issues, etc. Typically, the monitoring interval would be set to half of the P-F interval. This allows enough time for the technology to detect the problem and for corrective action to be taken. However, in certain circumstances, it may be necessary to collect data at shorter intervals than half of the P-F interval.
by Trent Phillips
With the shift in technology over the last ten years, it is easier to store pictures, music, and documents on a computer. The computer allows quick access to files and the ability to share them. Of course, with technology there are risks, but most can be minimized. One of the worst things that can happen is for the computer to crash or the hard drive to malfunction, rendering all your files unretrievable. A computer has a lot of ways to duplicate your files, but this is usually thought of too late. Once your computer crashes it is usually too late to make a copy or a backup of your files.
Creating a vibration database takes time and effort to make certain everything is entered correctly for your facility. Once everything is set up correctly, vibration data is collected and transferred into the vibration database. That vibration database is a health history of the machines for which vibration data was collected. Many additional items can also be stored within condition monitoring software such as machine photos, repair invoices, infrared images, and work orders to name just a few. How important is the data that is contained within your database? It is strongly advised that your vibration database be backed up on a regular basis. What constitutes a regular basis? It is suggested to back up your database after any major change. The rule of thumb for backing up a database should be related to how much additional effort would have to be expended in order to get the database back to its current state.
It is very easy to back up your condition monitoring database. A decision will need to be made as to how and where the database will be backed up. If you are running a network version of the condition monitoring software, then in most cases the IT department is backing up the server where this database resides. If you are a standalone user, then the responsibility of backing up the condition monitoring data rests on your shoulders. You should consider copying the database to a flash drive or creating a CD/DVD. Does your IT department have a shared network drive that is being backed up every night? That would also be an excellent place to copy your database. It is fine to have multiple backups of your database but be certain that the backups are recent and not months or years old.
A regular backup policy can save time, effort, and protect your valuable data. The cost of external data storage is very inexpensive and allows for the vibration database to be backed up too many different media types such as CDs, DVDs, external hard drives, and USB flash drives as examples. Being proactive should not only apply to your maintenance program but should extend to the backing up of your vibration data!
by Mickey Harp CRL
As Published by BIC Magazine May 2013 issue
A relatively small investment in training is a win-win scenario for the plant with a huge return
LUDECA has trained its customers’ maintenance personnel for more than 25 years. The incidence of mistreated laser alignment systems coming back for repair drops dramatically when a plant’s millwrights are properly trained in the use and care of the system. A relatively small investment in training is a win-win scenario for the plant with a huge return.
Many plants cognizant of the benefits of good training invest in a separate fully funded training department with highly qualified instructors. If you do not have this, do not hesitate to hire outside experts to come in and train your personnel, but ensure these experts really are qualified to train. Research credentials and follow-up on references.
Buy the best systems you can afford and really train your people to use them, or your equipment will be underutilized or mishandled. A well-equipped, dedicated training center provides a controlled environment where employees can learn undisturbed to their maximum potential. Equip it with good lighting, sanitary facilities, quality tables, comfortable chairs, a generous coffee pot, the latest SMARTboard™ technology, projectors, computers, and Internet access.
If you cannot provide a good training environment in-house, send employees away for training. Vendors who offer such services should have better facilities for this than you do. Ensure they do! We went out of our way to build and equip our own state-of-the-art training center and staff it with highly qualified people.
If you cannot afford to send away several employees at a time, send your most qualified employee or resident instructor for more in-depth training to have the knowledge brought back. We offer intensive “train the trainer” courses and in-depth courses for day-to-day users of our alignment and vibration systems. For us, it is a win-win proposition — well-trained users of our systems learn to love them, use them correctly and care for them properly. We offer an educational discount for systems purchased by training programs or educational institutions.
Six students per class is ideal (eight max) to allow the instructor to devote individual attention to each student, answer all questions and ensure each student gets hands-on practice. Each pair of students is assigned their own training simulator and complete laser shaft alignment system or vibration data collector and computer and necessary peripherals. Each student gets a complete set of training materials and an operator’s handbook for the system being learned to keep.
Vibration training is regarded as complex, and it can be at the more advanced levels. Yet a solid understanding of the basics of machine vibration and its underlying causes will benefit you greatly. Maintenance employees will be more attuned to spotting potential problems than they otherwise might and become more valuable, proactive members of your overall reliability program. Understanding what causes imbalance and its consequences, and what causes a bearing to fail prematurely is valuable knowledge for your employees, saving you money in the long run.
by Alan Luedeking CRL CMRP
Most equipment failures are not age-related. The equipment will provide some sign of impending failure if we have the right tools available to understand the change in condition.
A lot of facilities assign monitoring intervals based upon arbitrary schedules such as 30, 90, 180, or 365 days.
Often this is due to a lack of understanding of how equipment fails, misunderstanding of how conditional tasks such as vibration analysis work, available labor, and lack of importance placed upon Condition Monitoring (CM) efforts. These arbitrary collection intervals can actually lead to failures that go undetected and a loss of value from the effort. The equipment will tell you how often monitoring must be completed. Not understanding this can lead to costly results!
How does your facility determine the correct monitoring intervals for CM efforts? Is it based upon manpower, gut feel, P-F Interval, or what someone told you to do?
by Trent Phillips
Combine vibration monitoring and ultrasound for more cost-effective predictive maintenance
The best overall machinery monitoring program is one that utilizes multiple, integrated monitoring technologies.
In brief:
- The best overall machinery monitoring program is one that utilizes multiple, integrated monitoring technologies that are well-suited to detect expected failure modes.
- One goal of PdM is to determine how much time is left before a machine will fail, so plans can be made to minimize downtime and damage while still getting the most useful life from the machine.
- An application where ultrasound and vibration work well together is a mechanical inspection.
Reliability-centered maintenance programs are most effective and most profitable when a variety of appropriate technologies and tools are used to complement one another. Vibration analysis and ultrasound are as complementary as two sides of the same coin. Ultrasound is a useful monitoring tool, capable of detecting failing rolling element bearings and over-and under-lubrication conditions. The best overall machinery monitoring program is one that utilizes multiple, integrated monitoring technologies that are well-suited to detect expected failure modes. For low-risk machines, vibration analysis can be performed by a mechanic or operator using a vibration data collector or vibration meter. For machines of higher criticality, a certified vibration analyst should use advanced vibration data collection and analysis hardware and software.
Read my comments in this valuable PLANT SERVICES article.
by Trent Phillips
If you are a vibration analyst or are responsible for managing a Condition Monitoring (CM) program or reliability effort, you are probably keenly aware of the “what have you done for me lately” mentality. This is a mentality that may frustrate us somewhat, but if we think about it, it is only natural. In fact, if we are honest with ourselves, we will probably find we apply the same mentality to others at times.
This being the case, it is very important that we keep our management team apprised of the value they are getting from us, our tools, and our training. This is not a personal pride thing, but simply a part of business operations. Corporate management reports regularly to stockholders, showing the value of their management. Investors are willing to maintain their investment in a company, so long as they know they are getting a valuable return on their investment. In the same way, management will be willing to sustain their investment in CM along with its practitioners and equipment, as long as they are aware they are getting ample value in return for their investment.
CM efforts provide direct and positive contributions to key indicators like reduced downtime, reduced repair costs, reduced parts inventory need, increased production capacity, etc. If tracked correctly it will be clear to management that CM provides a big return on investment (ROI). Do not hesitate to bring Management’s attention to the many ways that CM contributes to the business goals of your facility or corporation.
Many companies are so accustomed to the CM department detecting unbalance in fans and the like and then driving the remediation of the problem (via cleaning, repair, and field balancing) that they no longer appreciate the value of such things. If the CM manager is not careful, he may find himself wondering what happened, because he took it for granted everyone appreciated the value of the CM contribution to the bottom line, only to find out that some of his people (or even himself) are seen as expendable because the value of their work is not fully appreciated. In this era of downsizing and “leaning up”, this is a chance no one should take. Document the actual savings in parts, labor, lost production, and downtime that you generated with your CM successes by averting the potential failures that would have occurred without your efforts.
by Mike Fitch CRL