“What’s shaking?” was a commonly used question many years ago to ask someone how things were going. It was very generic and could cover a vast range of things. It is still used today but the frequency in use has declined.
When that question is asked of a person, the normal reply is “Not much.” or “Everything is good.” But beware if asking this question to a vibration person. The reply would be “Everything.”; everything is shaking, but it’s the amplitude and frequency of the shaking that is the deciding factor. The first thing that will be noticed after answering the question is the blank stare in the eyes of the person that asked the question. If at a party or gathering with non-vibration people that person will try to excuse themselves away after hearing the reply.
Of course, as a vibration person, the blank stare means that further explanation is needed to assist with the understanding of frequency and amplitude to the questioner. This should help them understand what is really happening when things shake, or more precisely when they shake too much. The thinking is that maybe with an explanation the blank stare will vanish, leaving a glint of understanding in the person’s eyes. Nothing could be further from the truth. As the party has no whiteboard to draw on except cocktail napkins, using hand gestures to explain frequency over amplitude and how side banding can tell a lot about which component is failing on a machine, only changes the blank stare to a trapped animal expression.
After an hour of educating this person, my wife usually walks up to save the unfortunate victim. She whispers in my ear that we had an agreement. If anyone were to ask what I do for a living I would say I work with computers and not mention vibration. Of course, I did find a loophole as he asked me “What’s shaking.” not “What I did for a living.”, but that is another story.
The moral of this story is that there are a lot of people that do not know or care about vibration. Our job is really two-fold in that we have to make certain the machines we monitor run as long as they can, and that we can explain the condition of the machine to a “non-vibration layperson” in a very short summary.
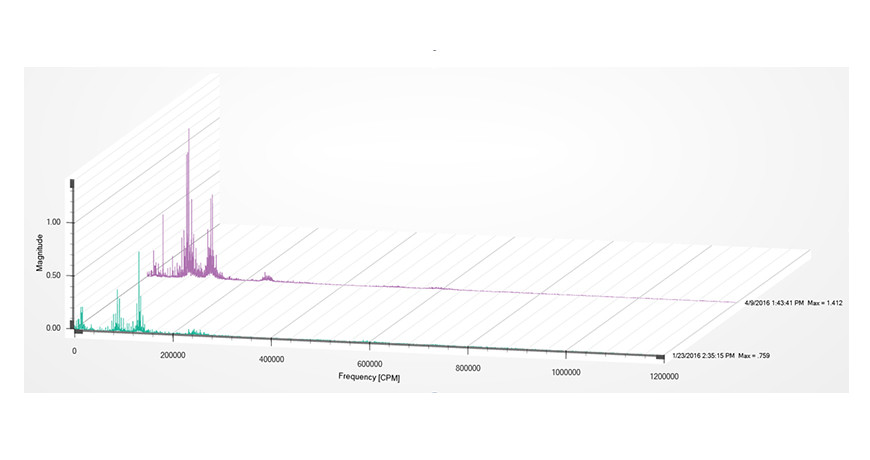
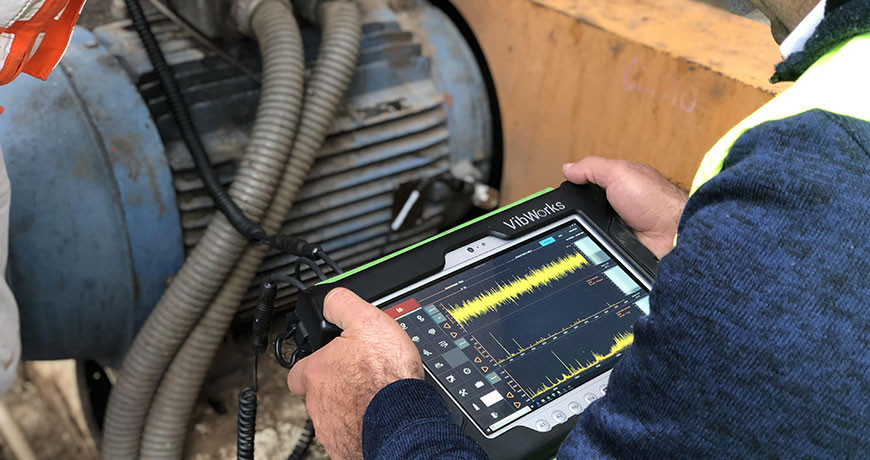
I find that showing a picture of a machine spectra containing high amplitude vs. the same machine many months ago when the vibration levels were low will allow the viewer to be able to see the differences without too much vibration explanation needed. A picture is really worth a thousand words, and if you add alarms and color to the report it helps push across your point.
Remember to keep the reports simple for others to see and have a detailed report for yourself that explains everything.
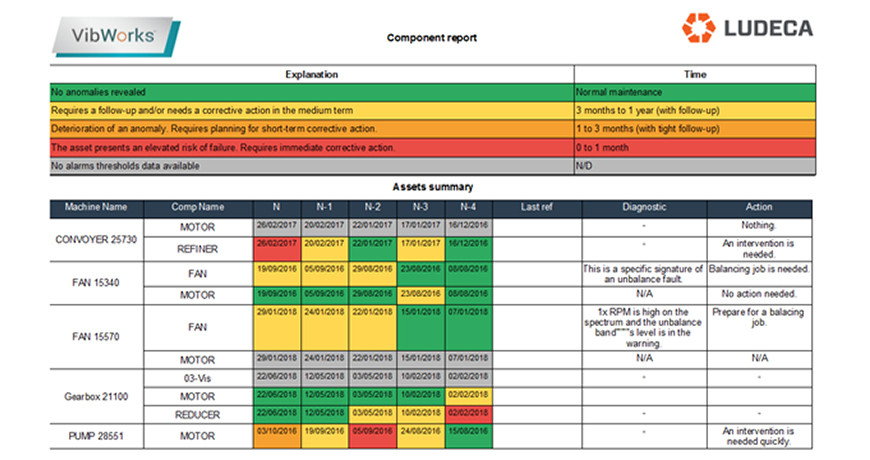
The example below is from a Component Report which displays when the data was collected and what alarms were seen during the collection dates.
If you are interested in seeing all the reports that are offered in the VibWorks software please contact us to schedule an online presentation.
by Diana Pereda
Simon is a condition monitoring specialist from a local oil refinery. He contacted SDT for advice on predicting flexible coupling failures. Currently, they perform condition monitoring on their pumps and motors using vibration analysis. They identified most bearing failures in time but could not detect coupling defects; there was no safe place to mount a contact sensor. Several unexpected failures caused shaft damage and unplanned downtime.
Within the facility they identified 58 pump systems considered “A Critical”, meaning if they go down, the plant goes down. I suggested ultrasound as a fast, safe, and affordable coupling monitoring solution. The model I recommended not only provided Simon with a means to observe couplings, it also measures vibration, eliminating the need to carry two data collectors.
Vibration analysis performs poorly on flexible couplings for two reasons. First, there is no suitable contact point for an accelerometer. Second, the primary defect symptoms of a defective coupling are friction and impacting. These are best detected with ultrasound. An airborne sensor placed near the coupling quickly detects problems. If necessary, Simon can capture a dynamic measurement and trend the defect as it worsens. The SDT270DU gives Simon two choices. He can periodically check for defects (Good) or Simon can integrate all 58 couplings into his established bearing routes (Best).
I explained to Simon how several clients already trend couplings using the Flexible Wand. The SDT270 collects a STATIC ultrasound measurement that gives four indicators of the condition. The first two – Overall RMS and Max RMS – indicate the level of friction produced by the defect. When these indicators rise, maintenance may consider corrective alignment during a planned shutdown. The second two – Peak and Crest Factor – identify the emergence of impacting. Together, all four indicators establish a lifecycle trend for each coupling.
Once impacting appears, the Peak indicator increases in step with Overall RMS. Since Crest Factor (CF) is a ratio between RMS and Peak, a rising CF indicates that the window for simple maintenance has narrowed. At this stage, inspectors collect a DYNAMIC measurement. The DYNAMIC measurement gives a visual representation of friction and impacting severity using the time view. For both STATIC and DYNAMIC measurements, it’s important to define the signal acquisition time.
User-defined signal acquisition time, available exclusively on SDT instruments, is a luxury that lends ultrasound technicians the highest level of precision. Without the ability to set the sample time, inspectors must guess when to pull the measurement trigger, and then question the validity of their data. Simon explained that all 58 pumps turn at speeds above 1800 RPM. Accordingly, he should set his SDT270’s signal acquisition time to between one and three seconds. This guarantees data samples over 30-90 shaft revolutions.
Shaft couplings are guarded for safety and ultrasound inspectors working around rotating equipment must follow company safety policies. SDT designs safety considerations into their solutions. The Flexible Wand’s 10mm diameter sensor allows access to couplings without the need to remove safety guards. The 21” long sensor sports a comfortable, ergonomic grip that keeps the inspector’s hands at a safe distance.
Simon seemed convinced but wanted to #HearMore. Since this solution was already working well at a nearby paper mill, I introduced Simon to the plant manager, Sunil, and invited them both to lunch. Sunil and Simon connected on many common reliability issues that afternoon. He confirmed the affordability of this solution based on coupling failures alone but went on to explain how their mill was rolling out ultrasound for acoustic lubrication, steam trap monitoring, electrical inspection, and air leak management. Simon and Sunil continued their conversation well into the afternoon. They agreed that ultrasound, with its 8 application pillars for reliability, represented a fast, safe, and affordable technology with the potential to revolutionize reliability culture. I sat back, happily watching two passionate specialists strategize about reliability culture. I love my job.
Related Blog: Ultrasound for Coupling Inspection? Yes!
by Diana Pereda

Many shafts have keyways cut into them to hold the coupling. “Keys” are pieces of square metal stock inserted to hold the hub in place.
If there are two (2) keys, one on each side of the coupling, you should not “align” the keys across the coupling. Instead, it is very important to ensure the coupling mass is balanced during installation. The mass of a key is balanced by setting the two keys 180 degrees apart from each other. If the keys are set on the same side, the coupling will induce a mass unbalance situation.
Often a vibration report will note a misalignment condition, but precision alignment techniques will not find any issue. This can lead to friction between the vibration analyst and the millwright. Keep the keyways 180 degrees apart. You will help improve the life of the coupling and keep the vibration low.
by Diana Pereda
Every person that performs vibration analysis develops his or her own analysis process. Suggested steps at a minimum should include:
- Open the spectrum (FFT) and locate the running speed peak and reset the reference speed to that speed. Since all induction motors vary in speed based on the load, this is necessary for accurate analysis, particularly at multiples of running speed.
- What are the dominant peaks?
- Are there any other peaks of interest?
- Where is the primary energy located?
a. Is it sub-synchronous, synchronous, or non-synchronous? - Do the waveform patterns support the peaks in the spectrum (FFT)?
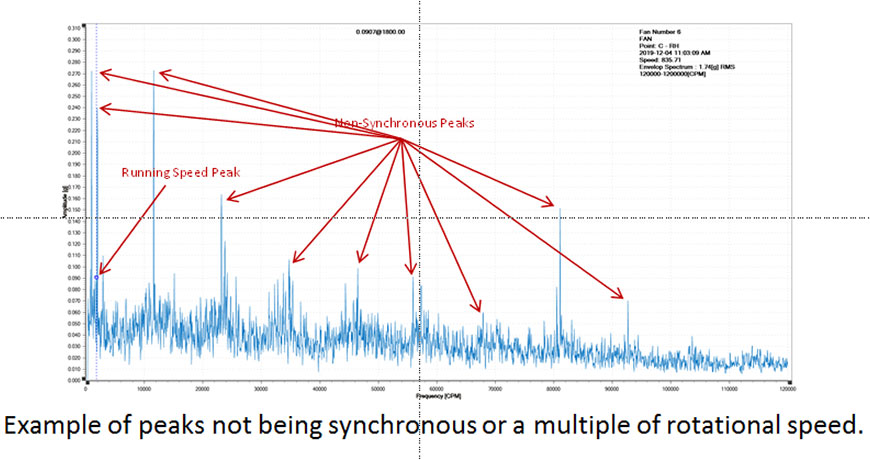
- Remember that defects follow patterns. Some defects happen at frequencies less than running speed (sub-synchronous) or at running speed or at multiples of running speed (synchronous), or at frequencies greater than running speed but not at whole integers (non-synchronous).
- Learn pattern recognition and don’t overlook the obvious.
- Generally, most equipment doesn’t have only one issue going on, learn to sort out the various problems and tackle the worst one or ones first.
Test Your Vibration IQ and see how much you know and maybe learn something along the way!
Related Blog: The Importance of Vibration Analysis
by Diana Pereda
A sensor generally measures 95% of what it’s capable of measuring in line with the sensor. Two common types of vibration sensors are:
-
Single axis accelerometers
-
Triaxial accelerometers
So which one is best for your application?
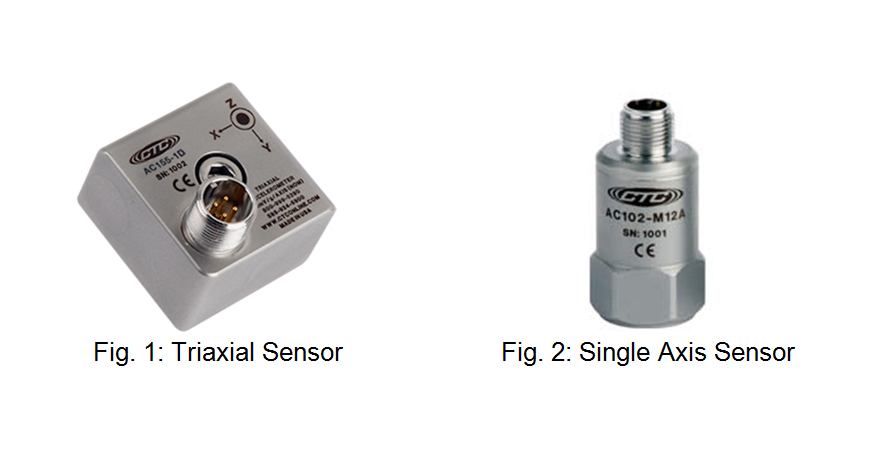
A single axis sensor simply measures vibration in only one axis, so the sensor can be moved to the direction or axis of interest to be measured. A triaxial sensor has three sensors built into one housing and therefore can measure three axes or directions without having to relocate the sensor, as with a single axis sensor.
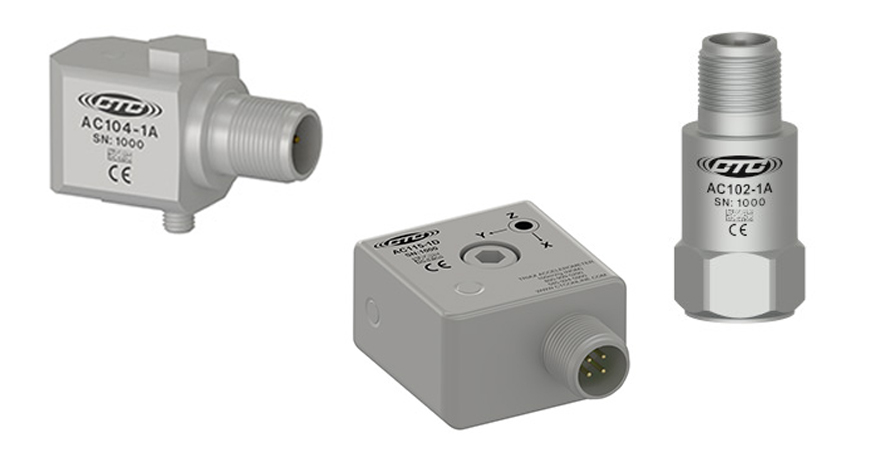
Image Courtesy of Connection Technology Center, Inc. – CTC
All data systems on the market today will use a single axis sensor, however, some are also capable of utilizing a triaxial sensor but not all three channels at once. Some two-channel instruments can use a triaxial sensor but they will only process two axes at one time then take the third axis reading. To collect all three axes simultaneously you need a true three-channel (or greater) analyzer. For example, the VIBWORKS vibration instrument allows for both triax and single axis data collection. The VIBWORKS is a true four-channel instrument. Triaxial data collection can be a time saver when collecting large amounts of data, but as with all things there are pros and cons. Using single axis sensors would typically involve moving the sensor from the horizontal to vertical to axial positions at each bearing to collect the data. Using a triaxial sensor you place the sensor at the bearing and collect all three axes simultaneously. Drawbacks to triaxial sensor are the cost of the sensor and cable; the sensor alone can cost 3× or more the price of a single axis sensor. At some facilities that use a triaxial sensor they simply place the sensor at a single location on a machine and take the three axis readings and move onto the next machine. Only if a problem is detected they return to the machine and take more precision data. The user must make sure the sensor is always orientated and placed the same each time readings are collected as the sensor has three axes X,Y, and Z and if the orientation of the sensor is turned the trend of the machine data becomes skewed or void.
by Diana Pereda
First one must know what the definition of phase is in the reliability world. Phase is simply the relationship between two events. There is absolute phase that is usually measured as either “phase-led”, which is from the peak in a filtered time waveform to the tachometer, or once per revolution indicator, or “phase-lag” which is from the tachometer or once per revolution indicator to the peak in a filtered time waveform. Of the two, phase-lag is probably the most common.
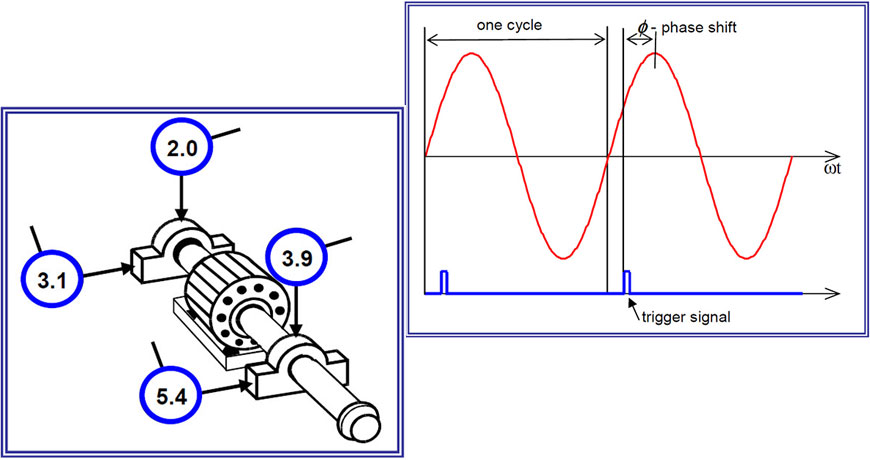
There is also relative phase which takes two filtered time waveforms and compares the phase between the two. Generally your Channel One or A (as the case may be) is stationary and you can move Channel Two or B from position to position and get the indicated phase. Relative phase can be a time saver as the user can get an indicated phase without shutting down the machine to put reflective tape on the shaft for a laser or optical pick-up. This can be used to verify or diagnose unbalance, misalignment, and looseness, etc., but it cannot be used for dynamic balancing which requires absolute phase for repeatable calculations. Whichever type of phase is used, you can use it to identify and/or confirm unbalance; check the phase on each side of the coupling as well as across the coupling to determine misalignment and what type of misalignment. Note: Always remember the orientation of the sensor as motion towards an accelerometer is positive energy in the time waveform and motion away from the accelerometer is negative energy in the time waveform.
The user can place the sensor on each side of a junction where two surfaces come together and look for a phase shift which indicates the two surfaces are not tight to each other. This could be looseness between a motor foot to the base, or from the base to the sole plate, or from the sole plate to the foundation, or even from the foundation to the slab. If everything is tight then the machine will move as one.
Phase can also be used to look for cocked bearings, bent or bowed shafts and other things as well.
Our advanced vibration analyzers, along with phase analysis, can help you better diagnose fault conditions.
Featured Graphics taken from Vibration Diagnostics report by Alena Bilosova and Jan Bilos – Ostrava 2012
by Diana Pereda
Primarily, there are three types of sensors in use today:
- Velocity transducer
- Accelerometer
- Proximity probe
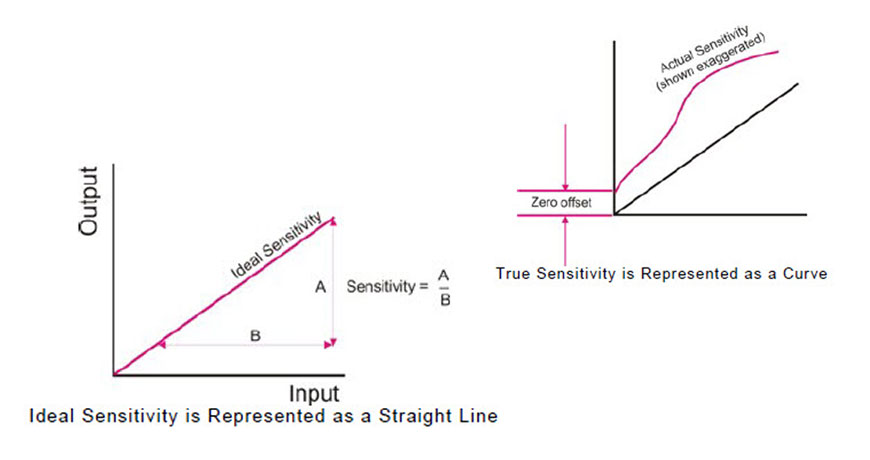
Each has its own sensitivity, which simply means that for a given input you get a given output.
Velocity Transducer
Simply a suspended magnet inside an electrical coil. The coil is affixed to the machine housing and moves with the housing, whereas the magnet attempts to remain stationary within that coil, thereby generating voltage. This sensor generally has an output of 1.0 volts per inch per second.
Accelerometer
Usually made up of a Piezoelectric Crystal preloaded with an amplifier, and, as the sensor housing moves due to vibration, the crystal is compressed and released, creating an output that for a standard sensor is 0.100 volts/g or 100 mv/g. Most accelerometers have a total voltage output of 5 volts or 5000 mv. With this sensitivity, if you take 5000 mv divided by 100 mv/g this gives you a range of 50 g’s peak.
Proximity Probe
Commonly called a prox probe. This sensor has a probe that is mounted through a journal or babbitt bearing and measures the movement of the shaft relative to the bearing. These sensors consist of the probe which has a magnetic coil in the tip that produces an eddy current when charged; this is connected to an extension cable which is connected to the proximiter. The proximiter is what powers the probe and supplies a signal to be monitored. The length of the probe cable and the extension cable determine the sensitivity. These are powered by a DC power source which creates the magnetic field at the probe tip. The probes are calibrated for specific shaft materials such as AISI 4140 steel, a low alloy steel containing chromium, molybdenum, and manganese which is widely used for shaft construction for rotating equipment; other types of materials are also used. When purchasing proximity probe systems you need to tell the supplier what the shaft material is so the probes can be properly calibrated. When installed, the static distance between the probe tip and the shaft surface is measured by measuring the DC voltage or Gap Volts; the movement or vibration of the shaft is a measurement of the changing or modulating of the DC—think of the gap volts as a DC signal and the vibration as an AC signal riding on the DC. The most common sensitivity of proximity probes is 0.200 v/mil, so for every 0.001 in. the shaft moves the voltage would change by 200 millivolts.
Take a look at our vibration analysis tools and how they interface with velocity transducers, accelerometers, and proximity probes.
by Diana Pereda
A route for vibration programs is the order in which machines that need to have vibration data collected on them have that data collected. To be able to optimize the data collection time and effort, the best practice is to have multiple routes. The machines in the route should be listed in a strategic and time saving list. If you were walking through the plant, which machines would be reached first, second, third, and so forth. The order of the routes themselves is very important as well and the time it takes to gather the data. If some machines (such as slow speed gearboxes) take a lot longer to collect data on, then perhaps a separate route might be needed just for them.
If the routes are not in a logical order then additional time is needed on the instrument to select the correct machine to start data collection. While 10 seconds might not seem that long to select the correct machine, if you have 200 machines on a route it could easily take an additional 30 minutes to finish that route if it is not logically configured. Data collection on that one route each month for the entire year could quickly turn into 6 hours of wasted time. Most plants have multiple routes and this wasted time figure could increase very quickly.
Routes are only the list and sequence of the equipment and do not hold any data themselves (within the VibWorks systems) and can therefore easily be deleted and re-created as many times as needed.
Reviewing your routes yearly could assist in eliminating wasted time.
by Diana Pereda
First off, “triax” is short for “triaxial accelerometer sensor”. A triaxial sensor has three (tri) separate sensors (that collect data in the X, Y, and Z directions) contained in one housing, compared to a single axis sensor in a normal accelerometer.
There are many pros and cons to using a triaxial sensor. A few things to consider:
- Cost
- Position
- Data frequency
- Time
The triax sensor (Fig. 1) is more expensive than the single axis sensor (Fig. 2). When using the triax sensor, it has to be mounted in the same orientation each time or the directions will not match the data that was collected before. Many places sell triax mounting pads to make certain that the sensor is locked in a certain orientation to ensure correct data collection. This represents an additional cost, and time must also be budgeted to mount the pads. Do not mix sensors when collecting data. If the same motor is having vibration data collected using a triax sensor, then do not collect data another month with a single axis sensor. A single axis sensor will need to be moved three times to the correct orientation for data collection whereas the triax was mounted in just one position. This could affect the trending of your data.
The VIBWORKS vibration instrument allows for both triax and single axis data collection. The VIBWORKS is a true four-channel instrument. This allows the instrument to collect data in all three directions at once. Normally three directions are taken per bearing on equipment. Depending on the setup and the equipment, it could take up to 20 seconds per direction to collect and save the vibration data. On a normal motor-fan machine train this means 12 directions which would take around 4 minutes to collect vibration data on, using a single axis sensor. Using a triax sensor it would only take 80 seconds to collect vibration data on the entire machine train.
When selecting a triax sensor, make certain that the vibration instrument is not multiplexing the vibration channels. For example it the instrument is only capable of two channels it will collect two channels at the same time and then collect the third channel separately. This means it would take almost three minutes to collect data as all three channels are not being collected at the same time.
by Diana Pereda
Where to place the vibration sensor depends on what data you wish to see. Certain defects show up better in the horizontal direction while other defects show up better in the vertical direction. So which location should I choose to place my vibration sensor? Most sensors in use today are single-axis sensors, so generally 95% of what they pick up or detect is in line with the sensor. Therefore, since placement of the sensor is crucial, some thought should be given as to what data shows up best in which of the three directions—vertical, horizontal, and axial. Data taken in the vertical direction will typically show looseness better than in the horizontal direction (at least on a horizontally mounted piece of equipment); however the horizontal will show unbalance better than the vertical. Axial vibration will show angular misalignment better than a radial reading will.
Also, it should be considered that in the real world there are times that the sensor cannot be placed directly on a bearing, such as with the non-drive end bearing on an electric motor due to the fan cover; on large motors this cover can extend 10 in. or more from the bearing, and considering that rolling element bearing generate high frequency data in early stages of failure and high frequency data only travels short distances, the data can and will be diminished the further from the bearing that you take your reading. In these cases you simply get as close as possible to the bearing knowing the generated signal may be diminished; in such case you should pay special attention to the frequencies present as they may be at lower levels than expected. If you are dealing with vertical equipment it’s typically stiffer in-line with the discharge than perpendicular to the discharge and that will affect your data as well.
For more information on a vibration tool to collect and analyze your sensor data, check us out!
by Diana Pereda
When using phase to determine how a machine is moving, the orientation of the sensor mounted on the machine is extremely important. In Figure 1 below one sensor is attached to the motor’s outboard (non-drive) end in one orientation, and on the other inboard (drive) end, it is mounted in the opposite direction.
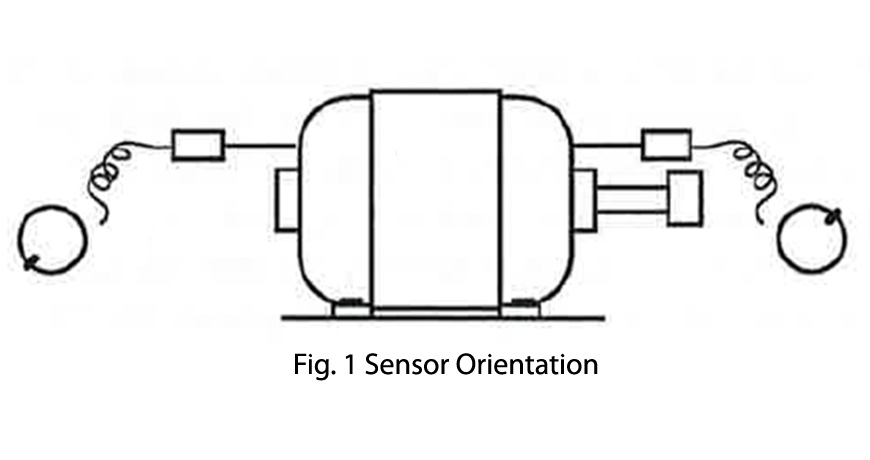
Because the sensors are attached to the motor’s ends opposite one another the resulting phase angles would be 180 degrees opposed to each other. To correct for this, the user has to choose a reference location and then correct the measured phase angle for any sensor locations where the sensor position is opposite the reference.
For measured phase readings of less than 180 degrees the user would add 180 degrees to the measured phase angle and for measured phase angles that are greater than 180 degrees the user would subtract 180 degrees from the measured reading.
In most applications this occurs most often in the axial direction of measurement; however, sometimes due to obstructions, the user cannot physically place the sensor in the same orientation as the reference sensor in the horizontal or vertical axis.
Just as with the axial direction, the user will have to determine a reference location and then correct the measurements for any locations where the sensor position doesn’t match the reference location.
Figure 2 below is what is commonly called a “Bubble Diagram”. The bubble diagram is used to record the vibration amplitude and phase angle at all machine locations in the machine train in the vertical, horizontal and axial directions.
As previously stated, the analyst must determine if any sensor measurement locations will require the sensor to be attached to the machine differently and adjust the phase readings at locations different from the reference accordingly.
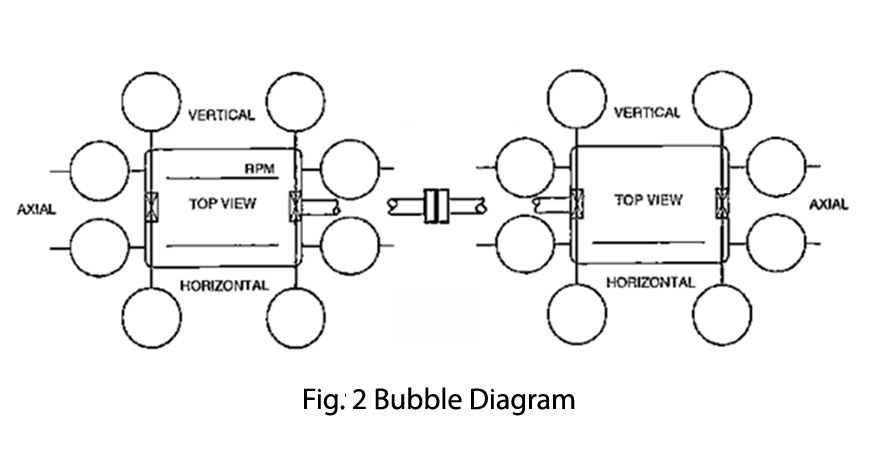
The easiest way to keep track of reference directions and location is to draw a little arrow as shown below in Figures 3 and 4. If the arrow is pointing towards the machine this indicates that the phase angle was recorded directly as indicated.

When the arrow is pointing away from the machine as shown above in Figure 4, the phase angle recorded in the bubble diagram is 180 degrees opposed from what was actually measured.
Source: Practical Solutions to Machinery and Maintenance Vibration Problems by Update International
Our advanced vibration analyzers, along with phase analysis, can help you better diagnose fault conditions.
by Diana Pereda
Vibration is everywhere! Vibration is a “back and forth” movement of a structure or component. Vibration can also be referred to as a “cyclical” movement. It can be inherent in a piece of equipment or can be induced by another form of energy. The real question is whether the vibration is detrimental to the equipment and its internal components.
Vibration is typically monitored through some form of analyzer, either online or offline such as the VIBWORKS analyzer.
What causes vibration? Here are just a few causes, but there are so more which can lead to elevated vibration levels. More importantly, if caught early enough, they can be corrected and thereby maximize the life of our equipment:
- Installation of the machines
- An improperly mounted bearing can cause severe vibration. This can lead to damage of the bearing as well as other components within the machine.
- Operation of the machine
- Pushing our machine beyond its recommended maximum output. Our machines respond by vibrating more than the recommended allowable limits and will eventually fail.
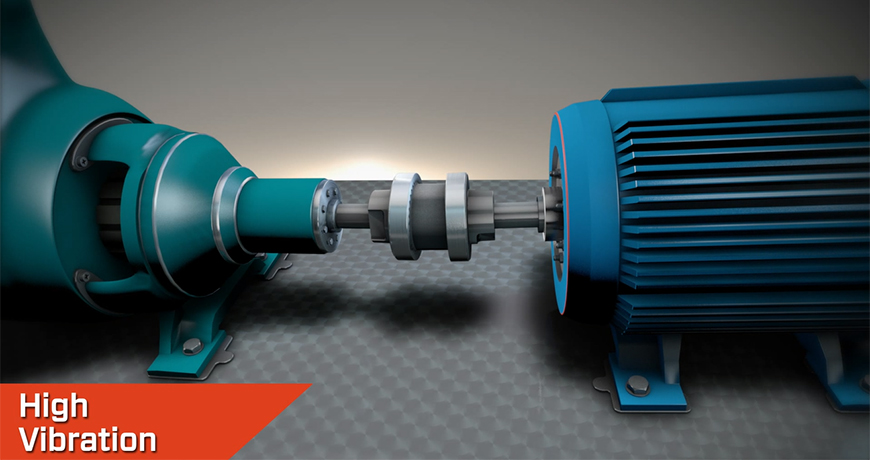
Watch our video ‘What’s Misalignment’ to learn more about the causes and effects of having misalignment in your rotating equipment
Some common machine problems that generate mechanical vibration:
- Misalignment
- Misalignment is one of the most common issues that leads to high vibration and eventually failure of the machine. It can be easily detected and corrected. Take the time to laser align machines properly to the recommended tolerance.
- Unbalance
- Unbalance is another easily missed problem that causes severe damage to our equipment. It can also lead to cracks of the housing itself. If not detected and corrected soon enough it can lead to dangerous catastrophic failure. Unbalance can be easily detected and corrected extending the life of the equipment.
We never have enough time to do things right the first time but always find time to do them again.”
These few issues can be easily detected with properly set-up software. Often, the setup is incorrect and inaccurate. Invalid data is captured in the FFT. Please consult an expert to make certain you are utilizing your condition monitoring software to its fullest potential. Remember… If it’s Critical and Rotates it should be Aligned, Balanced, and Monitored.
by Ana Maria Delgado, CRL
A vibration analysis package today could cost $20K, 30K, 40K, or easily more. If the wrong package is purchased, most companies are still committed to using it at least until it is depreciated, before they would be allowed to explore other alternatives, which could take 3 to 5 years. The purchased package may not include product support, or it might be available for a fee.
Purchasing the correct tool should include considering what the company as a whole is using; this could possibly allow you to take advantage of purchasing agreements with more favorable pricing. Purchasing a package that includes the right analyzer and software with the proper options will actually save money. It allows the user to collect the necessary or special data that may be needed.
If a tool simply won’t do the required job, people will quit wanting to use it and it can quickly become an expensive paperweight. When deciding on a vibration analysis system, you should make sure that you’re buying the right tool and not just what some salesman is trying to sell you. Your sales contact should discuss what your needs are and try to match these needs to the right tool.
The purchase cost of the right system can be recovered in just one correct call that saves you from a breakdown with all the attendant unscheduled downtime, repair expense, and lost production. As Benjamin Franklin once said:
“The bitterness of poor quality lingers long after the sweetness of low price has been forgotten.”
by Yolanda Lopez
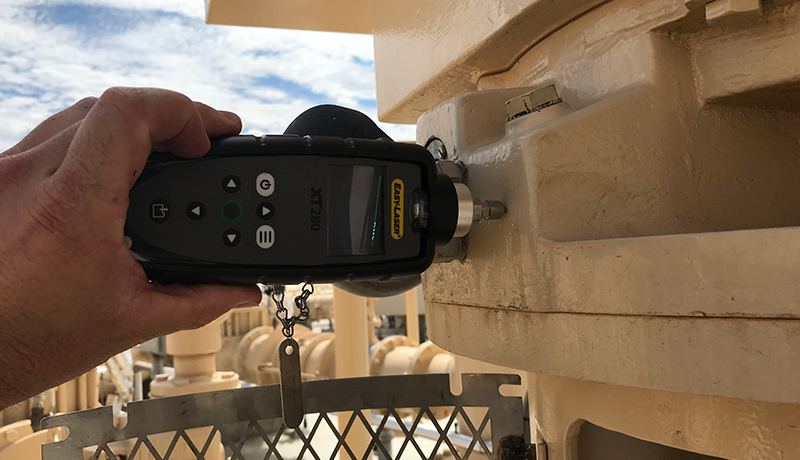 An overall level is a single number representing the amplitude of a vibration measurement. Overall values can be derived many different ways. You should be very cautious when assigning generic or the identical alarm values to your equipment. Similar machines can operate at different vibration levels. The individual characteristics of each machine should be taken into consideration when setting valid alarm levels. Even a simple vibration check revealing acceleration, velocity, unbalance or bearing noise can help you find and prevent equipment faults. You don’t need a sophisticated system for this; just a simple but good handheld tool (such as the EASY-LASER XT280) can help you with this.
by Ana Maria Delgado, CRL

In every facility there are pieces of equipment that are critical to the daily operation of the plant. Those machines are the ones that keep you awake at night. If the equipment fails or has a break down unexpectedly it has an adverse effect on production. An online vibration system can assist in giving you peace of mind for the health condition on that equipment.
Using an online system allows for monitoring of critical equipment 24 hours a day, 7 days a week, and 365 days a year. The ability to email or text alerts when alarm thresholds are met or exceeded allows for early detection of failures.
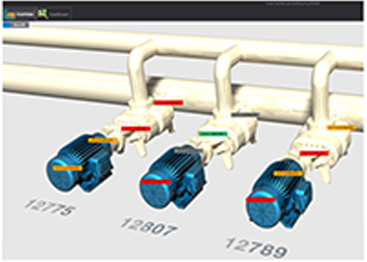
The CORTEX MONITORING SYSTEM (CMS) is a cost-effective, scalable solution, dedicated to the prediction of asset failure and the prevention of catastrophic failures and costly repairs. This innovative system will help you optimize your performance by monitoring the condition of your valuable assets with highly accurate diagnostic tools. CMS allows for easy access to the condition of the equipment at any time and from any place. The software can be accessed via the cloud using IIoT protocols and easily viewed on a phone, tablet, or any internet capable device. The images below show examples of what can be displayed using an internet capable device.
by Yolanda Lopez

Every analyst develops their own process for analyzing vibration data. This is generally learned from others, being around to observe or communicate with, or from training the individual receives. Often, the person collecting the data will be the same person that analyzes the data. The process could include that during the data collection the person not only uses the vibration data collector but also collects physical data from their senses such as sound and smell to see what is going on with the equipment. They ought to look for material under the coupling guard to see if an elastomer coupling is shedding pieces, which may indicate misalignment; look at the oil level if possible for signs of oil leakage; look at the mechanical seal area to identify other leakage. Once data is collected one would generally look for anything outside of established alarm levels, look at the spectrum to see where the highest amplitude peak is at, look for other high amplitude peaks or groups of peaks and harmonic families, and look for sidebands around peaks to help in identifying the source. You would also look for the direction of the highest vibration. Examine the historical data too: you would want to look at the rate of change to determine how quickly failure is approaching. Also never, never forget to look at the time waveform as all data comes from the time waveform. I try to look at the time waveform in the raw units of the sensor as that can verify what you may be seeing in the spectral and give you a greater understanding of just how bad a problem you may be facing.
If you need a solution to help ease this process, consider our BETAVIB vibration analysis systems.
by Yolanda Lopez

When the breakdown/repair cycle becomes routine, you can bet money is being wasted. The psychology of manufacturing (if we can call it that) is very much overlooked.
Q: What if it was a personal affront to everyone in the plant, management, production, and maintenance, for a machine to break down? Seriously. What if everyone viewed it as a personal failure when a machine failed unexpectedly? Do you think the necessary attention would be given to it? That might be revolutionary.
Of course, if too much time and effort are put into something, the cost will exceed the return, but if the necessary serious attention is given to an operating asset by EVERYONE, the next excellent idea that improves reliability could come from anyone.
“Ownership” is something we know to be beneficial in a manufacturing facility. We know that the more “personal” everyone feels toward the assets, the better they take care of them and the more creative they are about caring for them. When we feel that personal attachment of ownership, we are more forthcoming with our efforts and supportive of the efforts of others who share our valuation of the assets.
With this in mind I offer the following suggestion in order to tap into that inherent pride of ownership and personal attachment that many have to the company and assets of their occupation: LET EVERYONE SEE HOW UGLY IT IS!
Hang a sign on a machine that failed and shut your plant or process down. The sign should read,
This machine FAILED and shut our plant down:
Failed: August 30th, 2011
Failed: May 4th, 2015
Failed: January 19th, 2017
Failed: August 11th, 2018
And keep adding the dates. This way the bad actors become obvious to everyone, and even the MTBF will be obvious. The absence of a sign on a machine could then be as informative as the signs with dates.
If you can succeed in creating ownership of reliability that cuts across department lines, the benefits could be enormous. Failures come from all directions: Operations, maintenance, engineering, management, and procurement. Let everyone see the ugliness of it and encourage everyone to pull together to make it beautiful (or at least more attractive.)
by Yolanda Lopez

- Knows how to use the software package they have.
- Knows how to use the hardware they have.
- Knows where to place the vibration sensor to ensure good data.
- Knows how to recognize bad data.
- Knows what to look for while collecting data besides just the vibration sensor.
- Knows how and to whom to report their findings so that repairs are made, and gets feedback on the repair.
- Knows when to ask for help.
Learn more about LUDECA Vibration Analysis Courses
by Yolanda Lopez
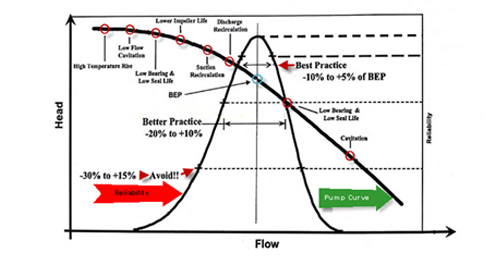
Centrifugal pumps have a specific design point at which they operate most efficiently. This sweet spot is known as the BEP (Best Efficiency Point) which provides the design engineer with the required flow and pressure while also providing the best efficiency. If the pump has been specified incorrectly or is placed into a system that doesn’t have the proper system head, the pump will become a reliability problem child. When a centrifugal pump is placed into a system without the required system resistance, the pump will run off its curve to the right, resulting in early bearing and mechanical seal failures and impeller damage caused by cavitations. If the pump is placed into a system with excessive system resistance, or, as frequently happens, the pump discharge valve is throttled early, bearing and seal failures occur along with impeller problems caused by discharge recirculation. Best practice dictates that the pump be specified and designed to operate within +5% to –10 % of its designed BEP. This will result in lower operating and maintenance costs and a happy pump.
by Yolanda Lopez
There are many different reasons to consider and implement an online vibration system. Some of the key reasons are:
- The equipment is critical to production.
- The equipment has a long repair time.
- The parts for the equipment have a long lead time.
- The equipment is not easy to access.
- The equipment is in a remote location.
- Equipment failure could endanger the environment or people.
Online systems like the CORTEX by BETAVIB allow not only vibration to be monitored but also many additional parameters (such as speed, temperature, pressure, and flow, to list just a few), all of which can also be monitored and recorded. In addition, a customized overview can also be created to allow anyone to quickly monitor the health of the equipment using red, yellow, and green alarms that will indicate if an issue is present.
The CORTEX Monitoring System (CMS) is a cost-effective, scalable solution, dedicated to the prediction of asset failure and the prevention of catastrophic failures and costly repairs. This innovative system will help you optimize your performance by monitoring the condition of your valuable assets with highly accurate diagnostic tools.
by Yolanda Lopez