There are many different reasons to consider and implement an online vibration system. Some of the key reasons are:
- The equipment is critical to production.
- The equipment has a long repair time.
- The parts for the equipment have a long lead time.
- The equipment is not easy to access.
- The equipment is in a remote location.
- Equipment failure could endanger the environment or people.
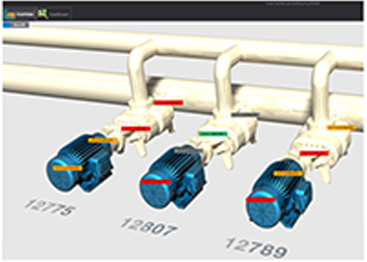
Online systems like the CORTEX by BETAVIB allow not only vibration to be monitored but also many additional parameters (such as speed, temperature, pressure, and flow, to list just a few), all of which can also be monitored and recorded. In addition, a customized overview can also be created to allow anyone to quickly monitor the health of the equipment using red, yellow, and green alarms that will indicate if an issue is present.
The CORTEX Monitoring System (CMS) is a cost-effective, scalable solution, dedicated to the prediction of asset failure and the prevention of catastrophic failures and costly repairs. This innovative system will help you optimize your performance by monitoring the condition of your valuable assets with highly accurate diagnostic tools.
by Yolanda Lopez
This blog post concerns rolling element bearings and not journal bearings.
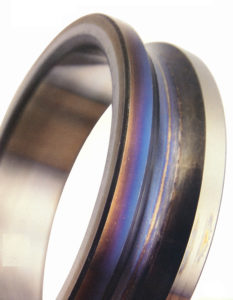 When a rolling element bearing begins to deteriorate the damage usually manifests itself in one of the races (either inner or outer) followed by the rolling element, and finally the cage. When the races begin to have defects these tend to excite the natural frequencies of the race which typically show up beyond the maximum frequency that most analyzers collect data to.
The specific defect frequencies are determined by the bearing geometry. One would normally start seeing peaks in the FFT spectrum in the 5× to 7× range and sideband peaks spaced at 1× rotational speed. As the defects progress, harmonics of the component defect frequency will move lower in the FFT with more harmonics showing, while the number and amplitude of the sidebands increases as well.
When you begin to see the defect frequencies of multiple components, then this indicates that the damage is progressing. In the time-waveform’s early stages you will see an increase in the amplitude of the peaks, indicating impacting; as damage increases the amplitude of the impacts will increase and for a time the pattern will resemble what is known as the “angle fish” pattern. This pattern will not last and may not even be seen depending on the frequency of the data collection. The pattern tends to go away because of continued deterioration of the bearing components.
by Yolanda Lopez
In most cases, when equipment is in failure mode, it begins to make sounds that are not commonly heard during normal operating conditions. Once this sound is heard a defect (at least one) is already present in the equipment.
Using our vibration tools can assist in detecting the defect before that sound is heard with the naked ear.
Think of a vibration sensor as a stethoscope that allows a vibration instrument to listen to the heartbeat of the equipment. The heartbeat is then recorded and data can be viewed historically for that equipment. The data can then be compared to other readings collected on the equipment to quickly see if any changes have occurred.
by Yolanda Lopez
With the proliferation of online monitoring systems utilizing permanently mounted sensors, users will need to beware of “direction sensitive” vibration and possible sudden unexpected failure due to insufficient data. The thought of insufficient data may seem incredible when thinking of constantly monitored equipment, but consider the all too common (IMHO) practice of uni-directional (one direction) monitoring of machine trains.
Many installations, due to initial cost, are mounting a single vibration sensor at each bearing. While this may be sufficient for most equipment trains, most of the time, it will certainly not be sufficient for all equipment trains all of the time. Although I don’t have hard data available, if I were to make a statement based on personal experience, and anecdotal evidence from other practitioners, my statement would be something like this: “80% of horizontal equipment could be pretty well monitored by sensors mounted at the horizontal radial position on each bearing.” I say pretty well monitored because I just can’t bring myself (as an analyst) to be completely satisfied without the vertical and axial data.
This setup would catch virtually all unbalance and roller bearing faults (excluding thrust bearings), some to most misalignment faults, and a sprinkling of others. I use the word “catch”, to mean it would give an indication of a developing problem. Accurate diagnosis of unbalance, misalignment, bent shaft, and even looseness in many cases (as well as a host of other possible faults) would require more data.
If the online vibration program manager takes these facts into account and governs the program accordingly, they should be pretty successful. If they add to the online program a “full battery” vibration survey, maybe semi-annually, just to catch the less common, but possibly very destructive defects that could develop undetected by the uni-directional monitoring, they would most likely be very successful.
What could be so destructive and yet be completely undetected by the uni-directional sensors? The Big R for one is Resonance. Resonance is often extremely directional. Consider a case history LUDECA co-published with one of our customers in the December 2012 Wastewater Processing magazine:
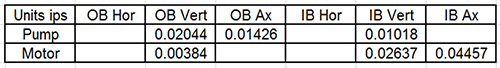
In the table below (Figure 1), the 1× amplitudes are displayed. I have hidden all but the vertical data, as though it were monitored only by vertical sensors.
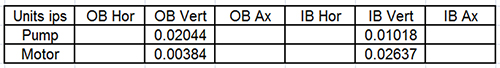
Everything is wonderful right? Look at the motor outboard vertical, only 0.00384 inches per second—very impressive. Of course, at this point you are thinking “he is setting me up for something” and you are correct. Even though most anyone would love to have these amplitudes on virtually any machine, this particular machine was tearing itself apart with vibration!
We will give the reader a little more data, just to help add emphasis to the directional nature of resonance. We will add the axial data to our table in Figure 2:
Still very, very good… so far. Now, look at Figure 3, with the addition of the horizontal data.
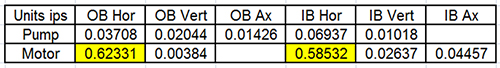
The motor outboard horizontal amplitude is 162 times the amplitude of the motor outboard vertical! What if the user had only vertically mounted sensors? What about vertical with the added information of axial? You may be thinking “if I had only horizontal sensors, I would have been ok”, and for sure you would have been better off than having only vertical. You would at least have known you had a problem, but you would not have known what that problem actually was. You would likely have assumed the vertical and axial are probably vibrating badly too.
Hopefully, you would have verified the vibration in the other directions. As it was, the user had data from all directions and a simple glance told the analyst with a high degree of confidence what the problem was. Resonance is almost alone in creating that kind of directional disparity.
To reiterate, the online vibration program manager should be successful if they take into account the fact of limited data and supplement the online program with a “full battery” vibration survey at a cost-effective interval, just to catch the less common, but possibly very destructive defects that could be developing undetected by uni-directional monitoring.
by Mike Fitch CRL
In today’s fast-paced competitive business world, manufacturers are seeking every competitive advantage they possibly can to increase their production and minimize costs while maintaining product quality. The identification of defects within a machine, reducing equipment failures and unscheduled downtime are increasingly demanded of condition monitoring technologies. Vibration analysis has proven to be one of the most effective tools for identifying mechanical and electrical faults within machinery. Most vibration programs use a combination of online monitoring and offline (walk around) monitoring. Off-line programs require the resources of a trained technician to walk from machine to machine to collect the vibration data.
The primary goal of vibration analysis is to identify faults within a machine and then alert personnel that some type of action needs to occur. Problems start to occur when the needed frequency of the data collection is not aligned with the maintenance strategy. A machine’s criticality, its risk priority, and its failure modes establish the frequency required; however, far too often frequency is determined by the availability of a local contractor, internal staffing, or, even worse, how much money will be saved if the frequency is changed from monthly to quarterly?
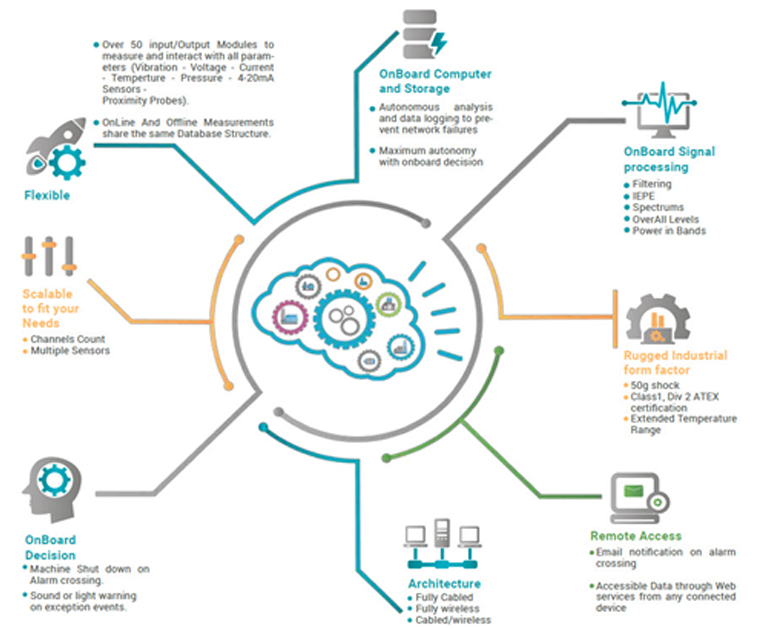
Today’s online systems have the ability to provide continuous monitoring and can send alarm notifications which can be incorporated into a site’s process control system so operators are alerted of a problem. Some systems can be configured to distribute emails or even send text messages to specific individuals based on an alarm state. Most vibration analysis systems today also have the ability to monitor and alarm off-process data such as temperature, pressure, voltage, current, flow, or speed and can provide alarming if a process measurement goes outside of a predefined range.
Some of today’s online systems can incorporate onboard logic and decision making and some vendors offer machine diagnostics so that data is analyzed and screened for alarm violations automatically. Data storage can be accomplished by the end-user locally or the data can be stored and accessed via the cloud. Utilizing a cloud server allows Reliability Engineers, Vibration Analysts, or Condition Monitoring Contractors the ability to analyze and view data, alarms, trends, and reports from anywhere in the world.
The “Industrial Internet of Things” (IIOT) is changing the way vibration data is viewed and managed. Developments in Artificial Intelligence, Smart Machines, Embedded Intelligence, Machine Learning, and Data Analytics are changing and significantly affecting how condition monitoring data is collected, processed, and presented to users.
Related Blog: The Importance of Purchasing the Right Vibration Analysis System
by Dave Leach CRL CMRT CMRP
How many facilities only collect vibration data when it doesn’t interfere with other activities? So often collecting and analyzing data is only one part of a given person’s responsibilities and workloads dictate that the collection and/or analysis take a back seat. When this happens, machine problems are not detected and therefore not reported for corrective action to be taken. If a machine then fails management has all the right to ask why the problem was not found and reported, even if management itself is the reason the data was not collected or analyzed! Vibration data collected should also be analyzed in a timely manner (within two business days of collection) to allow for proper scheduling of any needed repairs; of course, if problems are detected while collecting data that are believed to be severe enough to merit immediate attention, then they should be reported immediately to the facility. Many analysts do not know how long it will take to approve, plan, order parts, kit out, and schedule the resources to execute the repair work. Therefore, one must collect, analyze, and report the data as soon as possible. Generally, you may find several problems in most facilities; however, if you hand in 20 or 30 reports to the Reliability contact, they can quickly be overloaded. I would collate and deliver all the necessary reports but would focus on the top 5 priority problems first, based on safety, criticality, severity, and production demand.
by Trent Phillips CRL CMRP - Novelis
Condition Monitoring Expert Tip #9 by Mobius Institute
No, sadly, that may not be correct. If the spectrum (and phase readings) indicate misalignment, then the machine will be misaligned. But if there is no indication of misalignment, the machine may still be misaligned. I know that may not make sense, but unfortunately, it is true.
A number of experiments have been performed where real machines were misaligned and the vibration pattern did not change. The vibration pattern depended upon the type of coupling and other conditions, but the bottom line is that the only way you can be sure that the machine is precision aligned is to precision align the machine with a laser alignment tool.
We appreciate Mobius Institute for allowing us to share this tip with you!
by Ana Maria Delgado, CRL
Condition Monitoring Expert Tip #7 by Mobius Institute
Spectrum analysis provides a great deal of information about the health of rotating machinery. But you should consider the spectrum as a summary of the vibration within the machine.
The Fast Fourier Transform takes the time waveform and computes how much of each frequency is present and displays that as a line in the spectrum (grossly summarized, but that is basically the case). Therefore, if the vibration from the machine is generated by smooth periodic motion, then the spectrum provides a very good representation of what is happening inside the machine. But as damaged gears mesh together, and rolling elements pass over damaged areas on the raceway of the bearing, and as the pump vanes push through the fluid causing turbulence or cavitation, the vibration generated is not smooth and periodic. And there are a lot of other fault conditions that likewise do not generate smooth and periodic vibration. Thus, the only way to really understand what is happening inside the machine is to study the time waveform.
The time waveform is a record of exactly what happened from moment to moment as the shaft turns, the gears mesh, the vanes pass through fluid, and the rolling elements roll around the bearing. Each minute change that results from impacts, rubs, scrapes, rattles, surges, and so much more is recorded in the time waveform and then summarized in the spectrum. Therefore, it is critical to record the time waveform correctly and analyze it when you have any suspicion that a fault condition exists.
Special thanks to Mobius Institute for letting us share this condition monitoring expert tip with you!
by Ana Maria Delgado, CRL
Condition Monitoring Expert Tip #6 by Mobius Institute
The vibration spectrum can provide a clear indication of certain fault conditions, but when you see a large peak at the running speed (1X) what will your diagnosis be? What if you also see peaks at 2X and 3X? Now, if you are monitoring a large fan with a history of building up on the fan blades, then you may reasonably conclude that the high 1X peak indicates unbalance. But in the more general case, how do you distinguish between unbalance, bent shaft, looseness, resonance, eccentricity, misalignment, cocked bearing, and other fault conditions? This is where phase analysis is your friend.
Once upon a time phase analysis was difficult to perform because most people owned single-channel vibration analyzers. But with a two-channel analyzer and two vibration sensors, it is very easy to perform phase analysis. By simply placing one sensor vertically on the bearing and one sensor horizontally you can determine if unbalance exists. By comparing the vibration from one end of the machine to the other (on the same axis) you can confirm the unbalance diagnosis and assess whether it requires single-plane balance or two-plane. Comparing phase axially across a coupling, and radially across the coupling can help you diagnose and confirm misalignment.
We could go on and on, but phase analysis is the best tool for distinguishing between all of the listed fault conditions and more.
by Yolanda Lopez
Condition Monitoring Expert Tip #5 by Mobius Institute
Now, this is a tricky question to answer… We have a few contenders: high-frequency vibration analysis, regular vibration analysis, ultrasound, oil analysis, wear particle analysis, and infrared analysis. Let’s start by ruling a few of them out.
Infrared analysis is used to detect heat in a bearing, which is a late-stage fault condition, so that’s not your best option. Regular oil analysis can detect the presence of the wear metals within the bearing, but wear particle analysis is a better tool for that. Regular vibration analysis (i.e. velocity spectra) provides very clear indications of bearing faults, however, the high-frequency detection techniques provide an earlier warning. That leaves high-frequency vibration analysis, ultrasound, and wear particle analysis.
Ultrasound is the easiest to use. Push the probe against the bearing and listen carefully and you will hear if the bearing is in distress. (You can also record and analyze a waveform, but now you may as well be performing vibration analysis). Many would argue that high-frequency vibration analysis (such as enveloping, PeakVue, shock pulse, and others) provides a clearer indication of the nature and the severity of the fault. But it does require more training and potentially a more expensive system to perform the collection and analysis.
And that leaves wear particle analysis. Let’s just say that if you own critical gearboxes, you absolutely must perform wear particle analysis. Performed correctly, you will detect the first signs of wear, and complex gearboxes provide a greater challenge for the vibration analyst and the ultrasound tools.
Although I haven’t really answered the question, I am hoping to have put you in a position to make the right decision for your situation.
Thank you Mobius Institute for this valuable tip!
by Yolanda Lopez
Condition Monitoring Expert Tip #4 by Mobius Institute
This tip is sponsored by IMVAC (International Machine Vibration Analysis Conference)
There is no doubt that technologies such as vibration analysis, oil analysis, ultrasound, and infrared are very powerful. They can tell you a great deal about fault conditions in rotating machinery, electrical systems, and more. But if the criticality warrants it, you will be in a much stronger position if you have multiple technologies indicating that a fault condition exists rather than relying on just one.
For example, if vibration analysis indicates there is a problem in a gearbox, oil analysis can confirm the fault with the presence of wear particles. In the case of vibration analysis, you can utilize high-frequency analysis, spectrum analysis, time waveform analysis, and phase analysis to enable you to validate your diagnosis.
There can be a great deal at stake when you make a diagnostic call on a piece of equipment. More so if it is critical equipment. At the very least, a false diagnosis may lead to equipment failure (if you miss the fault condition) or it can lead to unnecessary work and downtime. What’s more, your reputation is at stake. Sadly, people often forget when you make the right call, but it can take years for people to forget when you make the wrong call.
Thanks, Mobius Institute for sharing such valuable information with us!
by Ana Maria Delgado, CRL
There are two commonly used testing methods to determine a vertical pump’s natural frequency. The first method is called a startup or coast down. In order to perform this method, a tach signal is required for the speed to be tracked. The pump is started and the amplitude and phase are recorded during start-up and coast down, however, when a pump is started across the line (connected directly to a power source without a drive or soft-start circuit) it is very difficult to use this method. The problem is that when a pump is started across the line it goes from zero rpm to full speed so quickly that there is not enough time to obtain valid data. The coast down method is not normally successful in these cases. When the stop is initiated the pump comes to a complete stop in a very short period of time as the liquid inside the pump column falls back to the wet well acting as a brake. However, start-up and coast-down testing can be performed successfully if a pump is being operated using a VFD (Variable Frequency Drive) as the rate of speed can be controlled.
The other method of determining structural natural frequencies on a vertical pump is to conduct an impact test. This test is more commonly known as a bump test. This test requires that the pump be stopped and impacted using a block of wood or a large hammer that has a soft tip (modal hammer). The bump test provides a response curve that will identify the natural frequency and/or frequencies of the pump. It is recommended that the testing be performed in two separate directions. One direction would be in-line with the pump’s discharge pipe and the other direction should be 90 degrees from the discharge pipe. The two different directions will usually result in two different natural frequencies as the pump’s discharge pipe tends to stiffen the structure. This vibration data can be shown as a higher natural frequency from that direction. The other direction which is 90 degrees from the pump discharge will usually have a lower natural frequency. This is due to the fact that the pump manufacturers typically cut out part of the structure. This allows access to the coupling or seal which also dampens the structure in that direction.
Both of the mentioned methods can assist with discovering the natural frequencies of a pump. Once the frequencies have been identified on the pump; the proper corrections can be made to make certain that the pump is not operating on a resonance frequency.
Learn more about our Condition Monitoring tools
by Dave Leach CRL CMRT CMRP
First and foremost vibration data setups must be properly configured to allow the correct results to be collected thus allowing the analyst to interpret the vibration data for defects. The defect findings should be presented in a manner that the personnel that is responsible for the repair of the equipment now have the necessary information to perform their intended function. The vibration data alone will not fix anything. A vibration database must have the proper setups, the vibration data must be collected correctly using the appropriate instrument, and analyzed by a properly trained and confident analyst. This allows for the root cause of the problem to be found as opposed to only replacing parts. It is very critical that the correct person becomes the vibration analyst. This person should have the desire and drive to become the best that they can become at that position. The analyst should also have support from upper management to allow them to focus on one job.
With the right people, right tools, and support you will have the meaningful data to drive and sustain valuable results and continuous improvement.
by Gary James CRL
Strobe lights are an inexpensive tool typically used to determine the operational speed of the equipment. Strobe lights should be readily available to vibration analysts and maintenance mechanics. A strobe can be used as a proactive tool for many things. For example, visual inspection of belt damage (slippage, wear, etc), coupling damage, loose components, and much more can be identified with this handy tool, while the equipment is running. Don’t overlook the value a strobe light can provide beyond just the simple determination of the operational speed of a machine. But keep two things in mind: SAFETY must be first and foremost in your mind at all times when using a strobe light. Since a strobe can appear to “stop motion” on moving components, the temptation to touch the object you are looking at can be strong at times. Avoid this temptation and always stay focused on what you are doing. Also, people prone to epileptic seizures triggered by flashing lights should avoid exposure to a strobe light.
by Trent Phillips CRL CMRP - Novelis
As Published by COMPRESSORtech2 Magazine October 2016 issue
by Karl Hoffower – Condition Monitoring and Reliability Expert for Failure Prevention Associates
Combining ultrasound and vibration sensing adds precision to recip valve analyses
Over the past decade, ultrasonic condition monitoring of reciprocal compressor valves has become more widely known. However, it does not seem to be widely used.
Ultrasonic testing measures high-frequency sound waves, well above the range of human hearing.
These ultrasound devices record the high-frequency signals for analysis later. Trending valve cap temperatures is the most common condition monitoring technique for monitoring
compressor valve health.
Ultrasonic testing of compressor valves and vibration monitoring of rotating components is an informative, preventative-maintenance practice. Compressor valve deficiencies with opening, closing, or leaking may be diagnosed using the ultrasound recording functions.
Steven Schultheis, a Shell Oil Co. engineer, addressed the issue in a paper presented at the 36th Turbomachinery Symposium in Houston in 2007.
“Trending valve temperatures have proven to be valuable in identifying individual valve problems, but are most effective if the measurement is made in a thermowell in the valve cover.” Schultheis wrote. “Ultrasound has proven to be the preferred approach to the analysis of valve condition.”
Failure Prevention Associates completed an experiment with a major midstream gas transmission company to see if this type of condition monitoring tool can effectively find fault conditions well before another technology is used.
Ultrasound meters (such as the SDT270 from SDT Ultrasound Solutions) have digital readouts that indicate the level of ultrasound detected. These devices have been used for decades to “hear” air, gas, and vacuum leaks. The intensity or amplitude of the signal is expressed in decibels — microvolts. (dB[A] μV). The dB(A) is a common intensity unit for sound intensity; μV designates the engineering reference unit being used with a piezoelectric sensor.
Converting an airborne ultrasound detector with a contact sensor allows a technician to monitor what is happening inside a machine, whether it is a bearing, steam trap, or valve.
Ultrasound detectors are designed to operate in a specific and narrow frequency band. Then through the “heterodyning” step high frequency sounds down into an audible format that the technician can hear through headphones. During the heterodyning process, the quality and characteristics of the original ultrasound signal are preserved.
Read full article complementary-condition-monitoring-boosts-reliability-article
by Yolanda Lopez
As Published by Maintenance Technology Magazine August 2016 issue
Clinging to a single approach that made economic sense for your plant ‘back in the day’ could be an expensive strategy.”
Overall values are the most common measurements and calculations used in vibration analysis. What’s more, some reliability and maintenance programs rely solely on them. The goal is to remove monitored equipment from service once the overall vibration level exceeds a certain threshold. Although this approach would appear to be quite cost-effective, in reality, it frequently isn’t. In fact, overall vibration monitoring can become extremely costly for a facility.
If you are asking yourself questions such as: What should you do once an overall vibration level exceeds your target amplitude and the equipment is removed from service? Who should collect routine vibration data? What other valuable condition-monitoring data might be missing? Or how do you motivate others to take corrective actions? then this article is definitely a must-read.
by Trent Phillips CRL CMRP - Novelis
How do you obtain the desired return on your assets? Availability, maintainability, and reliability are foundational elements required for a proper return on your equipment. Condition Monitoring is a tool that can help you build these elements and obtain the desired returns. Condition Monitoring can be completed while equipment is running to maximize uptime and help provide better overall reliability. Conditional changes can be identified before functional failures that result in downtime occur, preventing other unwanted consequences.
Unneeded work can be avoided (unnecessary PMs, failures, etc.), and better planning and improved scheduling achieved through CM.
Use Condition Monitoring as a means to build a solid foundation for your facility!
by Trent Phillips CRL CMRP - Novelis
May 2016 · Plant Services Magazine
Like a lot of reliability engineers, Joe Anderson, former reliability manager at the J.M. Smucker Co., appreciated – in theory – that precise pulley alignment is critical to preventing vibration problems and ensuring successful operations.
My understanding was, ‘Yeah, we need to do it,’ ” Anderson says. “But you always have these excuses.”
When the Smucker’s plant at which Anderson worked launched a dedicated vibration monitoring and control program a year-and-a-half ago, though, Anderson quickly became a convert to making precision alignment a priority.
The plant purchased a vibration analyzer (VIBXPERT®) and laser alignment tool (the SheaveMaster® Greenline) from Ludeca to help aid in identifying machine defects that appeared to be linked to vibration caused by misalignment. Laser alignment allowed for correcting vertical angularity, horizontal angularity, and axial offset – the three types of misalignment – simultaneously. Whoever was using the laser alignment tool, then, could be sure that adjustments made to correct one alignment problem didn’t create an issue on another plane.
Read the entire article to learn how J.M. Smucker Co. made precision alignment a priority: Get your alignment in line: Don’t jiggle while you work
by Ana Maria Delgado, CRL
Guest post by Karl Hoffower – Condition Monitoring and Reliability Expert for Failure Prevention Associates
Location and placement of your sensors are crucially important when doing predictive vibration analysis.
1) Below is an example of proper sensor installation on a cooling tower gearbox. These two sensors are placed in different directions to follow both the gearbox vibration as well as indicate if the fan blades become unbalanced.
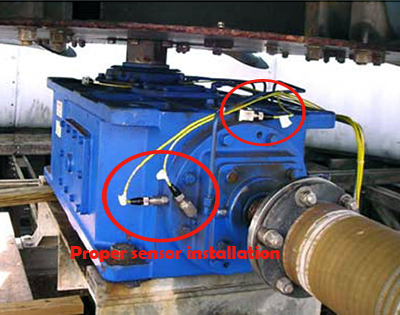
Read Vibration Sensors for Cooling Towers case study from CTC for details on proper sensor installation on cooling towers.
2) This example of poor sensor placement is on a vertical motor using a belt drive for a fin fan.
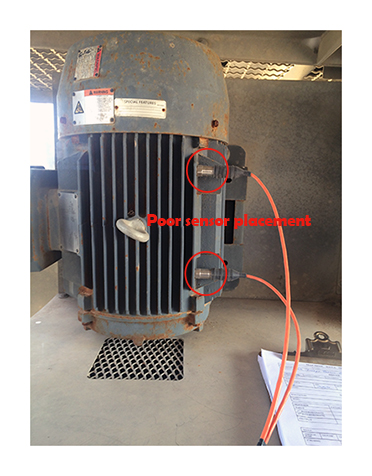
PROBLEM
- The vibration sensors pictured on the left are attached to one of the motor fins. Watching these sensors, one could visually see the fin and sensors oscillating as if on a trampoline.
SOLUTION
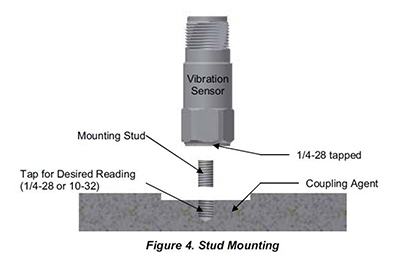
- The choices are to face, drill & tap (see figure #4 below).
- The other option would be to epoxy a mounting pad to the bearing housings. Then screw the sensor into the mounting pad.
3) Another example of poor sensor placement on a 4-20mA shutdown switch on a gas recipient compressor at a facility in Texas.
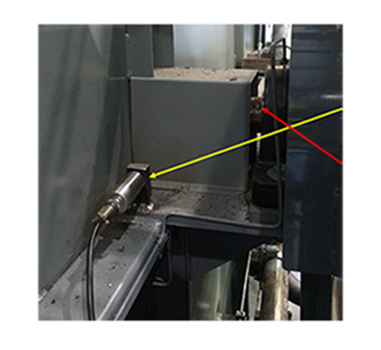
PROBLEM
- The vibration sensor (yellow arrow) is a 4-20mA accelerometer used for asset protection in an automatic shutdown setting. It is monitoring the overall vibration levels emanating from the bearings and shaft (red arrow).
SOLUTION
- The better choice would be to use a mounting pad attached to the pillow block bearing.
by Yolanda Lopez
Does your maintenance staff have to wait on parts, wait for the equipment to be available, search for tools to do their job, work lots of overtime, travel long distances to the job, etc? Most maintenance staff work in pairs. This means that when you see one of your maintenance staff struggling to do his job, then his counterpart is struggling as well. What is the result? You may have a hidden cost (twice the labor) that you did not realize!
What can you do to avoid this? Make sure that your work is correctly planned. Job plans should be created, and be accurate and available. The required parts should be staged once the work is planned. Machine drawings, special tools, permits, etc., required to complete the maintenance activity should be identified in the job plan and be available as part of the job kit. Once all of this is done the work should be scheduled. These steps will help your maintenance staff focus on work and not on searching for the resources they need to complete their assigned maintenance tasks. You will save money and have more reliable equipment.
by Trent Phillips CRL CMRP - Novelis