
The following lubrication issues can lead to pump fires. Here’s how to prevent them.
Lack of lubrication, over-lubrication, wrong lubricant and lubricant contamination
A lack of lubrication, an incorrect lubricant type, lubricant contamination and over-lubrication can all lead to increased friction and therefore heat. Insufficient lubrication results in increased friction between moving parts, especially bearings, seals, and the impeller. The overheating from friction may raise the temperature of pump components to a point where they can ignite the pumped fluid or other nearby materials. Insufficient lubrication can also lead to bearing failure, further exacerbating friction and heat generation. If the pump is handling flammable liquids such as oil, the heat generated by excess friction can ignite the fluid itself causing a fire. Using the wrong type of lubricant for the application may be just as harmful as lacking lubrication altogether, with the same consequences. Equally, contamination of the lubricant from ingress of foreign matter due to worn or damaged seals or from improper lubricant storage and handling methods can also result in ineffective lubrication, with devastating consequences. If a pump fire has occurred, do the following:
Remedies
- Secure the area: Ensure the area around the pump is safe. Immediately evacuate nonessential personnel from the area and alert fire control personnel.
- Perform an emergency shutdown of the involved asset: If safe to do so, immediately shut down the pump to stop the flow of potentially flammable material and reduce heat generation.
- Activate fire suppression systems and take appropriate measures to mitigate and extinguish the fire: If using hand-held fire extinguishers, make certain they are of the appropriate type for the type of fire involved.
- Investigate the cause: Once the situation is under control, thoroughly investigate the cause of the fire, focusing on potential lubrication issues and any other contributing factors. Why did the pump fire happen?
Preventing Future Incidents
- Implement a robust lubrication program that follows the equipment manufacturer’s recommendations. Adhere to the pump manufacturer’s recommendations for the correct lubricant type to be used, the correct quantity, and frequency of application.
- Implement proper lubrication storage and handling procedures, ensuring the correct labeling of all containers, preventing cross-contamination, and proper handling of lubricants when transferring from main storage to local dispensing equipment. Download our Oil & Grease Storage Best Practices infographic for some tips to help outline the best practices for proper lubrication storage.
- Use the correct lubricants for the application. This includes selecting lubricants of the appropriate type for the application that are also suitable for the operating environment and conditions, considering temperature, pressure, humidity and the pumped medium.
- Perform regular lubricant inspections in the machines: Routinely check lubrication levels and ensure adequate lubricant supply.
- Implement a Condition Monitoring program (vibration analysis) to monitor bearing condition. Pay close attention to bearing condition and lubrication during maintenance.
- Ensure that laser shaft alignment is done to the correct alignment tolerances, including proper target specifications for thermal growth, to reduce stress on bearings, couplings, and other components, as well as reducing power consumption and increasing efficiency.
- Inspect mechanical seals regularly and replace them as needed to prevent leaks and maintain proper lubrication.
- Establish Fire Safety Protocols for operating and maintaining pumps in potentially hazardous environments.
- Implement Training and Awareness programs to ensure personnel are trained in proper pump operation, lubrication procedures and fire safety measures.
Ludeca is here to help you with proper lubrication and precision shaft alignment. Check out our 5-Step Acoustic Lubrication Procedure and the Easy-Laser XT Overview for easy alignment.
by Diana Pereda

Lubrication is one of the primary tools of machine maintenance, it is used to mitigate the effects of friction. Friction is the resistance created when two surfaces slide or rub together. Any piece of equipment, machine, tool, or other mechanism with rotating or moving parts experiences friction. Friction causes heat and wear and must be reduced and controlled to prevent premature wear and damage to parts and equipment.
- Lubrication is the application of any substance that reduces friction by creating a slippery film between surfaces.
There are specific best practices for lubricating different machines and best lubricants for different environments and applications. In addition to different lubricants and equipment, there are computerized scheduling software and automatic delivery systems. Lubricants can be solid, semisolid, and liquid.
- Liquid lubricants: Oils
- Semisolid lubricants: Greases
- Solid lubricants: Granules, powders
Lubricants reduce wear to moving parts by:
- Reducing friction
- Removing heat
- Sealing parts from dirt, grit, and moisture
Friction and wear between moving surfaces are reduced when a film of lubricant is applied to the surfaces.
There are four levels of lubricant film protection, from least to greatest:
- Dry friction: occurs when each surface is unprotected from the abrasion of the other surface by any lubricant.
- Mixed film lubrication: occurs when surfaces are partially lubricated.
- Boundary lubrication: occurs when metal to metal contact occurs between the high points of surfaces, but less friction is generated than with mixed film lubrication because they are covered with heavier film.
- Fluid film lubrication: occurs when all moving parts are separated from each other by the lubricant film and friction is minimal.
Benefits of lubrication:
Lubrication reduces friction and wear between moving parts, extending equipment life and improving efficiency, reliability, safety, and temperature control. Lubricants also reduce noise and vibration, prevent overheating, and absorb heat generated by friction.
Leading Technology:
Ultrasound solutions contribute significantly to asset condition management by providing insight into health assets, reducing energy waste and improving product quality. Ultrasound is one of the leading NDT tools on the market. The LubeChecker ultrasound tool takes out the guess work. No more “just give it 5 shots of grease” mentality. Instead, achieve precision lubrication to extend the life of your asset and reduce lubrication-related failures.
Safety Awareness:
Because of the many different types of materials used to make lubricants, they are considered hazardous materials. Workers must understand and know how to perform lubrication activities safely and efficiently. Special precautions must be taken when handling lubricants to prevent contamination of lubricants, cross-contamination of lubricants and equipment, as well as bodily injury and illness from toxic substances. Dedicated containers for new lubricants as well as receptacles for waste oil are a must, as is proper placarding, signage, and lubrication procedures.
Download our 5-Step Acoustic Lubrication Procedure an effective lubrication procedure to grease bearings right.
by Diana Pereda
In the first part of this series, What’s Dirt got to do with it? – Part 1: What is Contamination?, we got into the specifics of contamination and how it can be classified. For this part of the series, we will focus on being able to identify and prevent contamination. Ideally, lubricants can become contaminated easily, however, we need to be able to determine the tolerance levels that our systems can endure. For instance, the solid contamination tolerance in a diesel engine will vary greatly from that of a hydraulic system (with tighter clearances).
Ways to identify contamination
There are a couple of lab tests which can identify contamination but sometimes, you don’t need to wait until you get to a lab to confirm whether contamination has occurred or not. It may be visible in the oil (via a change in color or appearance) or even in the smell of the oil (strong odor where none previously existed).
The lab tests associated with contamination include:
- ISO 4406 – count of particles in the oil which fall within ranges of >4, >6, >14 μm per milliliter of fluid
- PQ (Particle Quantification) counting – the measure of iron in the oil
- NAS 1638 Rating – measures the particle count but is considered obsolete. This used to measure the particles within the ranges of 5-15, 15-25, 25-50, 50-100 and >100μm
- FTIR – identifies the presence of molecules and their concentrations
The ISO 4406 standard uses the following table to classify the ranges in which the volume of particles falls.


For an ISO code of 20/15/13 this represents:
- 20 – between 5,000 – 10,000 particles larger than 4μm in one milliliter or fluid
- 15 – between 160 – 320 particles larger than 6μm in one milliliter or fluid
- 13 – between 40 – 80 particles larger than 14μm in one milliliter or fluid
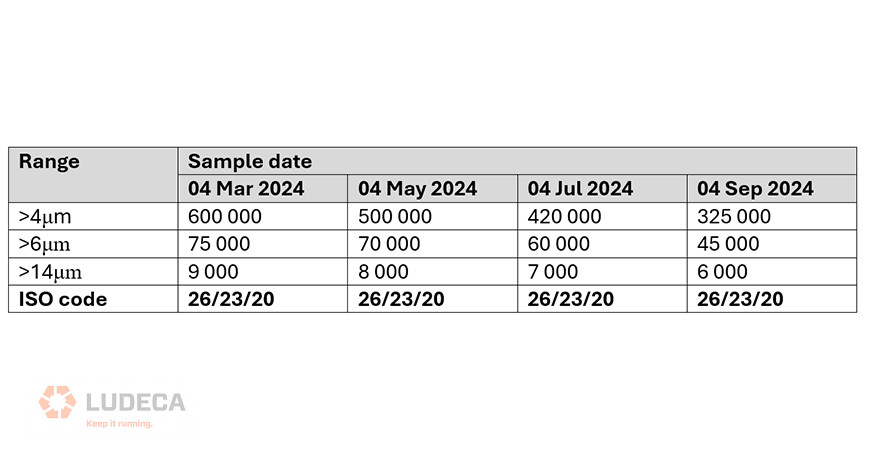
One can imagine how quickly those numbers can escalate! However, while this provides a good indication of the particles present, when trending over a period of time, it can be a bit misleading especially if the number of particles remain within the larger ranges.
For instance, if the raw results look like the table below, there will not be a change in the ISO 4406 code although there has clearly been a decrease in the number of particles.
Preventing contamination
With all the various types of contamination which exist, there are also quite a few methods to minimize their ingression to the oil. These include storage and handling for the oils coming into the equipment and methods of filtration for the oils already in the equipment.
When oils are received into the facility, they are not super clean. It is worthwhile verifying with your oil supplier about the cleanliness of your oil. Typically, oil suppliers should have a cleanliness level test completed before the packaging of the oils which is available per batch of oil. Since this is typically done before packaging, it would be a good idea to test the cleanliness of the oil after it is received at your facility to determine its true rating.
If oils are to be decanted from their original packaging into the sump of the equipment, then there are lots of opportunities in which these can become easily contaminated. Some strategies to consider:
- Utilize sealed, dedicated containers for the oil transfers. These can prevent the oils from being contaminated by gases, liquids (other oils) and solids. The containers should be dedicated to each oil type to avoid mixing of the oils. For instance, the oil container used to decant engine oil should never be re-used to decant hydraulic oil!
- When topping up sumps, be careful with opening hatches as these may have accumulated solid particles on them and these can easily fall into the sump leading to contamination.
- Store oils in a cool, dry place, not outside in the elements. Oil Drums can breathe and pull in accumulated water through their bungs essentially contaminating the oil before it reaches the equipment.
- If hoses are used to transfer oils, ensure that these are capped after use to minimize ingression of solid particles. Also ensure that these are properly labelled so the correct lubricant is placed in the associated sump.
For those oils already in the system, many times there are system filters which can catch some internally generated particles. It is a good idea to monitor these and trend the rate at which the filters are changed (if they are only changed when the differential pressures accumulate to a certain level). This can give an idea of the estimated rate of contamination in the system oil.

Additionally, if one of the oil analysis tests shows the presence of water, then there are a few filtration techniques which can be employed depending on the concentration of the water in the system. Some methods include; Gravity Separation, Centrifuge separation, Polymer Absorption, Vacuum Dehydration and Air stripping Dehydration. Fitting equipment with desiccant breathers is a preventive measure which can be taken as well.
Now that we can identify contamination and have found some methods to prevent it, we need to look at how much it is actually costing us by having contaminants in our system. Look out for the last part of the series where we discuss this.
Thank you Sanya Mathura with Strategic Reliability Solutions Ltd for sharing this informative and educational series article with us!
Download our Oil & Grease Storage Best Practices Infographic for some tips to help outline the best practices for proper lubrication storage!
by Diana Pereda
Dirt is all around us and while it may be critical for the plants to grow, it is not as warmly received in our machines. However, when we begin thinking about contamination, this is not just limited to dirt particles. Contaminants are anything that enters a system which should not be there or is considered foreign to that system.
In the lubrication world, contaminants can be classified into three categories: Gases, Liquids or Solids. Typically, all these contaminants can enter the lubricants at different stages of storage and handling or if there is an internal / external leak in the lubrication system. During these times, contaminants may get into the system without the operators knowing of their intrusion and can cause substantial damage to components.

Gases as contaminants
While gases may not seem like a large impact contaminant, they can cause serious harm to your machines. Usually, air (oxygen) is one of the most prevalent gaseous contaminants and since it is present all around us, it is a bit difficult to ensure that it doesn’t enter our systems. The presence of oxygen is usually not that dangerous unless it is coupled with other factors such as heat or other contaminants such as water.
If we have trapped air bubbles in our lubricants, this can also lead to microdieseling in our lubricants. In this process, the insides of our components can experience cavitation. On the other hand, the oil will undergo degradation often resulting in the presence of soot, tars and sludge due to the air bubbles collapsing. When the air bubble collapses, this can produce temperatures in excess of 1,000°C which leads to the degradation of the oil.
Other gases which can enter the lubrication system may be ‘process’ gases (such as carbon dioxide, nitrogen or even ammonia). Normally, a lot of the process gases are non-reactive with the lubricants. However, there may be some cases where these gases can be a catalyst to initiate other reactions within the lubricant (given specific conditions). As such, the ingression of any gas should always be considered a contaminant and then deemed harmful or not based on its nature.
Liquids as contaminants
In lubrication systems, liquids as contaminants or foreign material tend to be more prevalent than gases. Two of the most common liquid contaminants are water and fuel depending on the system. Both water and fuel have detrimental effects on the lubricant affecting its viscosity and by extension initiating damage to the internal components.
Water should never be present in any lubricant! However, it can exist in three different states if it is present. It can be free, dissolved or emulsified. Free water usually settles out at the bottom of the sump while dissolved water remains in solution with the oil (often leading to oxidation) and emulsified water exists where the oil has a hazy or milky appearance. In the emulsified state, water is most dangerous as it degrades the oil quickly and affects the pressure and lubrication properties of the oil.
Additionally, water can cause an increase in the viscosity of the oil. This can lead to additional energy being required for components to work harder leading to inefficient systems. It can also cause leeching of particular additives rendering the oil ineffective in its functions of protecting the components.
On the other hand, fuel dilution often occurs in diesel engines. Typically, this is a ‘process’ liquid getting into the lubricant. When fuel enters lubricants, it can decrease its viscosity causing the oil film to be thinner than it should. As such, the lubricant no longer provides protection between the two component surfaces and this often leads to wear.
While water and fuel are the major liquid contaminants, they are not the only ones which exist. Other lubricants can also be considered liquid contaminants especially if the wrong lubricant is mixed in with the intended lubricant. This is especially true for hydraulic oils being mixed with engine oils where the combination can be catastrophic as not all additives are compatible.

Solid contaminants
Solids are the most common type of contaminant as ingression of these particles occurs the most frequently during storage and handling of lubricants. Dirt is not the only solid contaminant for lubrication systems. In fact, many lubrication systems exist in industrial / manufacturing environments where there may be very fine particles (such as cement or even flour) which can easily enter these systems if they are left open to the environment.
In lubrication systems, it is easy to think that all solid contaminants come from external sources of ingression. However, internal sources may also be present. Usually, these can be in the form of wear particles which are internally generated due to inadequate lubrication, alternative forms of wear or even the production of solid deposits due to chemical reactions within the oil.
Whether solid contaminants ingress externally or internally, they can cause severe damage to the components in the form of wear or even creating blockages in very small clearances. Abrasive wear is one of the most common types associated with solid contaminants. However, cracks and fatigue wear can also occur from the presence of these contaminants. Depending on the type of solid contaminant, this can also act as a catalyst for degradation in the lubricant.
Whether it’s gaseous, liquid or solid, contamination is not an ally to any machine. If it is foreign to your lubricant system or doesn’t belong there, then it contaminates your system. Stay tuned for the second part of this series, where we talk some more about ways to identify and prevent contamination.
Thank you Sanya Mathura with Strategic Reliability Solutions Ltd for sharing this informative and educational article with us!
Download our Oil & Grease Storage Best Practices which provides some tips to help outline the best practices for proper lubrication storage!
by Diana Pereda

Contamination is one of the failure modes that we see quite often in bearing failures. Foreign matter such as dirt and moisture getting into bearings reduces the reliability of your bearings significantly. Here are some sources of contamination to avoid:
- Assembling bearings in a dirty environment: Bearings should be installed in a dry, dust-free room. If you have to mount them in an unprotected area, use a tarp or other means to make sure you keep them protected from dust, dirt and moisture until installation has been completed.
- Contaminated lubricants: Store your grease and oil in a clean and dry environment. Make sure that they are contained in quality containers and properly labeled to avoid cross-contamination and misapplication of lubricants.
- Worn integral metal parts: As the bearings age and wear, there will be contamination from metal particles as they wear. Proper installation and lubrication will slow this down considerably.
- Contaminated area around the bearing: Not only protect from dust and other airborne contaminants but also keep the area around the bearing as clean as possible to keep surface contaminants to a minimum.
- Dirty grease fittings: Simply cleaning the grease fittings with a lint-free cloth can keep contaminants from being injected into the bearing during regreasing.
- Faulty or worn seals: Pay attention to the condition of the seals. They are designed to keep lubrication in and contaminants out. Take care not to overgrease the bearing, which will cause a seal to fail.
Download our Bearing Storage Best Practices for some basics things to prevent bearing damage and contamination thus maximize bearing life and performance!
by Diana Pereda
In case you missed the first two installments of this article, be sure to check them out before jumping ahead to this last installment. In the first installment, we took a closer look at the reason for monitoring critical assets while in the second installment focused more on developing the oil analysis program as well as the types of tests you should use. This last installment will get you up to speed with the benefits of having an optimized oil analysis program.
Having an oil analysis program will always bring value to an organization. However, if the frequency of testing or the types of tests do not align with the equipment or what the reliability team is trying to achieve, then it can result in the being classed as an expense with no return on investment. This is one of the main reasons why oil analysis programs should be optimized.
In the first part of this article, we talked about categorizing assets into three main tiers; critical, semi-critical, and non-critical. Then we dived further into exploring the differences between basic and advanced tests as well as how often these should be utilized. By optimizing your oil analysis program, it brings more value to the organization as shown in the example below.
If we did not optimize the oil analysis program and perform advanced tests on non-critical equipment, then no value would be extracted from these tests. Let’s do a quick analysis of this using some average numbers in the industry.
Optimized oil analysis program example
Assume the following about our “operation”.
10 critical components, 15 semi-critical components & 20 non-critical components
The average price of a basic test kit is about UD10 per sample. Advanced tests are usually USD30-50 and more per sample. In this example, we will use USD50 as an average (just to make the numbers easy to work with).
If we group all our components together and implement mandatory oil analysis for all components at the same frequency with the same tests (basic & advanced) on a monthly basis, we could end up with the following:
- 45 components @USD 10 per month (basic test) = USD450 per month = USD 5,400 per year
- 45 components @USD 50 per month (1 advanced test) = USD 2250 per month = USD = 27,000 per year
That’s a total of USD 32,400 per year on oil analysis!
If we broke it down to an optimized program, we should get:
- 10 critical components x USD 10 per month (basic test) = USD 100 per month = USD 1200 per year
- 10 critical components x USD 50 quarterly (1 advanced test) = USD 500 per quarter = USD 2,000 per year
- 15 semi-critical components x USD 10 quarterly (basic test) = USD 150 per quarter = USD 600 per year
- 20 non-critical components x USD10 semiannually (basic test) = USD 200 semiannually = USD 400 per year
That’s a total of USD 4,200 per year on oil analysis!
An operator can potentially save USD28k per year just by optimizing their oil analysis program (given the hypothetical scenario above).
Also, in an optimized oil analysis program, the critical component testing has the majority of the budget. In this case, around USD3.2k per year. Does the cost associated with oil analysis bring any return on this investment? The answer is a resounding YES!

If a critical turbine fails for about 3 hours, it can cost the company hundreds of thousands of dollars. This is just for 3 hours in particular industries. A mere 3 thousand dollars for an entire year seems like an insignificant investment compared to the burden of hundreds of thousands of dollars for a failure which includes additional unplanned downtime.
There are many benefits of optimizing your oil analysis program besides the financial values show here which can include safety (less samples from high-risk areas for non-critical equipment), reduced paperwork (there is additional work associated with sending out each sample) and of course a reduced carbon footprint from sending off the number of samples to the lab.
Optimizing your oil analysis program is just one of the ways you can seek to make more impact on your company by increasing the value that it brings. It all begins with categorizing your assets and ensuring that you have the most appropriate frequency interval for sampling. These small changes can have significant impacts.
Thank you Sanya Mathura with Strategic Reliability Solutions Ltd for sharing this informative and educational article with us!
Implementing Lubricant Storage & Handling Procedures: Part 1 Understanding Contamination
by Diana Pereda
In the first installment of this series, Optimizing an Effective Oil Analysis Program for Critical Assets – Why Focus on Critical Assets? Part 1, we focused on the reason for monitoring critical assets while also diving into the other types of assets. For this second installment, we will focus some more on actually developing an oil analysis program and some things you need to know.
By establishing a matrix of your critical, semi-critical, and non-critical assets, it becomes easier to allocate the required amount of resources to the monitoring of these assets. These assets can be ranked in a tier system where the non-critical assets are the first tier, semi-critical are the second, and critical are the third. Ideally, resource allocation to these should resemble the diagram below.
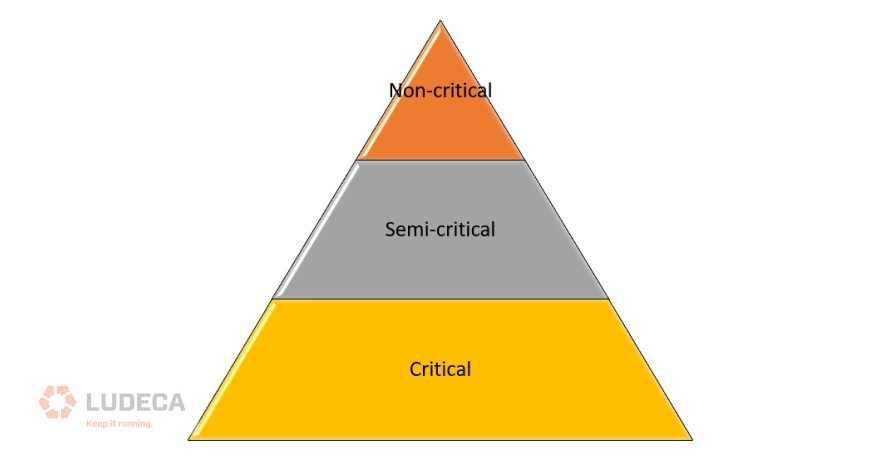
As seen above, the critical assets would require the most amount of time and resources. This helps us when developing an oil analysis program as we can determine the frequency of sampling and types of tests.
Used oil analysis programs will differ depending on the types of industry, equipment, and environmental conditions. For instance, it may be challenging to get oil samples from mobile equipment (such as an excavator, if they are on a customer’s site) compared to obtaining a sample from a stationary piece of equipment in a manufacturing plant.
Basic tests
When performing oil analysis, there are basic tests that transcend most oil types. These include; Viscosity, TAN/TBN, Spectroscopy (additives, wear metals, contaminants), Presence of water. These tests can give a preliminary indication of whether anything is occurring in the machine such as wear, if contaminants are getting in, or if there is a depletion of additives. They can guide us to the basic health of the oil and can be likened to having regular blood tests run by your doctor where they check for the level of red blood cells, white blood cells, and a couple of other values.
These basic tests should be done monthly for critical pieces of equipment as we need to develop trends which can aid us in the early identification of anything that may be of concern.
For semi-critical pieces of equipment, these tests can be carried out every quarter or at ¾ of the expected oil life of that equipment. For example, if the oil is changed every 500 hours, it would be a good idea to sample the oil at approximately 375 hours.
For non-critical pieces of equipment, these tests can be performed semiannually or about 1 week away from the planned date of oil change for the equipment. This ensures that the health of the asset is documented to allow trending to occur should something arise in the future. The cost of replacing the equipment should also be considered when determining the frequency of sampling. This can possibly move the asset from being non-critical to semi-critical.

Advanced tests
While the basic tests can help operators gauge the health of the asset, sometimes special advanced tests are also needed to better understand what’s happening inside the equipment. This is especially true for critical pieces of equipment as a greater insight into certain parameters can help prevent failures. However, these advanced tests vary by equipment / oil type.
For turbine oils (which are one of the most popular critical assets), there are quite a few advanced tests. This type of oil is usually subjected to extreme temperatures and conditions. As such, one of its main failure modes is oxidation (although others do exist). Therefore, some of the advanced tests for these turbine oils include; MPC (Membrane Match Colorimetry), RULER (Remaining Useful Life Evaluation Routine), FTIR (Fourier Transform Infrared) and RPVOT (Rotating Pressure Vessel Oxidation test – although this one does not give much repeatable results, it is still considered an industry standard). Typically, these tests may be carried out quarterly or semi-annually for critical pieces of equipment depending on what the user is trying to trend or monitor.
For gear oils, one may want to focus on the foam, water separability and wear tests as these have more impact on charting the health of these components. For critical gearboxes, if the oil has a high tendency to foam, this can lead to micro pitting and damage of the gears which in turn can cause the system to come to a standstill. These tests can be done quarterly for critical equipment and may only become necessary for semi-critical or non-critical equipment if an issue is being investigated. In these cases, there may be a root cause investigation underway to determine the cause of additional / unwarranted wear in these semi-critical or non-critical gearboxes.
When developing an oil analysis program, it is essential to categorize your assets to help determine the frequency and type of tests to be conducted. In this article, we focused on a simple three tier approach, but this can be more detailed and involved more tiers, it all depends on the organization in which we’re trying to implement the oil analysis program.
Stay tuned for the last instalment of this article where we explore the benefits of an optimized oil analysis program.
Thank you Sanya Mathura with Strategic Reliability Solutions Ltd for sharing this informative and educational article with us!
Do we really need Oil Analysis if We’re Performing other CM Techniques? – Part 1
by Diana Pereda
Our critical assets are the ones that get the most attention in our plants. They are considered the main drivers of production as without them, output can stop which directly affects the profitability of the plant. Quite often, these can be thought of as the heart of the operation as they need to be working all the time to ensure that the entire unit (human body) functions.
Similar to the heart in the human body, we regularly get checkups especially if we have family members who may have experienced heart complications in the past, our equipment is no different. We need to provide them with regular checkups (condition monitoring techniques), and these are given more attention if there is a history of failure for these critical assets. In essence, we can compare the heart of the human body to critical assets in our industrial plant or operations.
This 3-part series will dive into its first installment of why critical assets are important, it will focus on developing an oil analysis program and finally the benefits of an optimized oil analysis program.
Why focus on critical assets?
Shouldn’t every asset be critical? Not exactly.

Semi-critical assets
Let’s realign with the human body to truly understand this concept. If someone has one malfunctioning kidney, it does not mean that the entire body has stopped working. Hopefully, the other kidney is still working and able to filter the stuff it needs to keep healthy. In this case, the other kidney is a secondary asset. It will still allow the body to function, but it also means that the properly functioning kidney has twice the amount of work to do.
For our equipment, we can think of having secondary pumps or other components that come online if the main component fails. Now, while these may not be critical assets, they are still important as they have a function to execute. If they don’t come online, then our equipment can have a shutdown period or reduced production. These are considered semi-critical assets.
While these assets do not require as much attention as the critical assets, they are still important. As such, they would require slightly less attention compared to the critical assets. We will dive further into the frequency and types of analyses for these semi-critical assets further on in this article.
Non-critical assets
Back to the human body, we all have fingernails and toenails. What happens if we lose one of them?
It’s not considered a huge loss (maybe more of an aesthetic loss) but they will grow back eventually (fingers and toes crossed). While they are missing, they are not preventing the body from performing any of the regular functions. These are what we consider non-critical assets.
In our industrial plants or operations, the non-critical assets are the components that can come offline but not disrupt production or directly affect the bottom line. Even though they are non-critical, they still perform a function in the entire operation, so they should not be ignored.
Critical assets
Unlike semi-critical and non-critical assets, critical assets are those which directly impact the operation of the plant. For instance, if a turbine in a power plant goes down, this will affect the output capacity of the plant and may even render some areas without power. Especially in the instance of a power plant, when a turbine goes down, the power plant may be fined for not providing the contracted amount of power. Therefore, this is one asset that we want to ensure is available most of the time.
By constantly monitoring the health of the lubricants for critical assets (in addition to using other condition monitoring techniques), we can predict the onset of a failure and possibly make the appropriate corrections/adjustments before the failure occurs. As such, more time is dedicated to monitoring these critical pieces of equipment compared to semi-critical or non-critical equipment. The value of the dedicated resources to monitoring these critical pieces of equipment greatly outweighs the costs involved in their shutdown.
Stay tuned for the second and third installments of this series as we cover developing the oil analysis program and the benefits of an optimized oil analysis program.
Thank you Sanya Mathura with Strategic Reliability Solutions Ltd for sharing this informative and educational article with us!
Do we really need Oil Analysis if We’re Performing other CM Techniques? – Part 1
by Diana Pereda
Addressing the storage & handling challenge (Part 3)
In our previous articles, we covered understanding contamination and the role of storage and handling. For the last part of this series, we will talk about addressing the challenge of storage and handling of lubricants.
Factors that affect lubricant degradation
Storage and handling are one of the areas of lubrication which can be easily addressed. There are simple steps that a site can perform to ensure that their lubricants do not contribute to unwanted downtime or loss in production. There are 5 factors that can affect the degradation of a lubricant as it relates to storage and handling. These are;
- Temperature – one of the rules of thumb within the industry is that for every 10°C rise in temperature above 40°C, the life of the lubricant is essentially halved. Imagine storing lubricants outside in temperatures of more than 40°C or even in a closed warehouse where temperatures get to that value!
- Light – sometimes, light can lead to the oxidation of light-sensitive lubricants like transformer oils.
- Water – the presence of water in any lubricant is never a good sign. These can cause additive depletion and in the case of transformer oils may lead to conducting electricity!
- Particulate Contamination – as seen in the previous articles, contamination by particles can occur during the handling of lubricants (decanting them into dirty containers) or even if the lids of the lubricant packages are left open for extended periods.
- Atmospheric Contamination – typically, this occurs if the packaging is left open. This usually promotes some form of oxidation which can eventually affect the functionality of the lubricant.

Storage & Handling Solutions
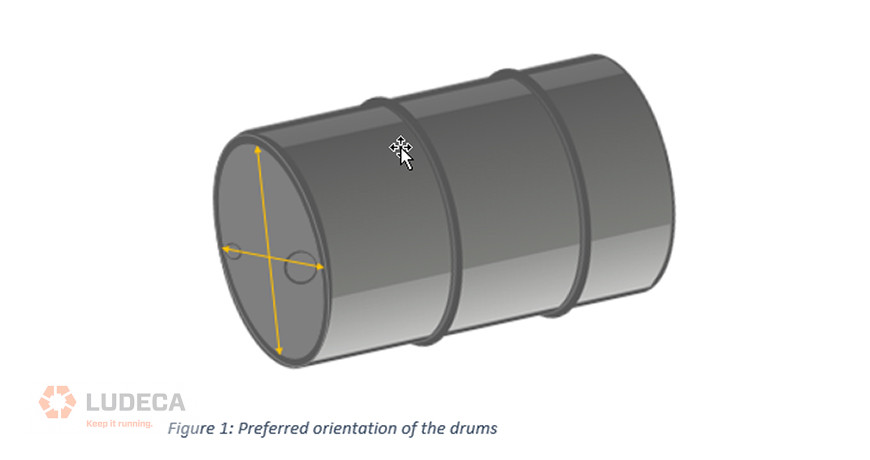
Warehouses should ensure that lubricants are not stored outside in the elements. If there is no alternative to this type of storage, then the packages should be covered with a tarpaulin or some other covering which can protect the lubricants from light, water, or ingress of atmospheric particles. As mentioned in the second installment of this article, drums should be stored in a 3 o’clock and 9 o’clock position to minimize ingress of water through drum breathing. Or if these have to be stored in the elements ensure that they are covered and protected.
When decanting lubricants, these should always be decanted into clean containers or containers which have not been left open to the atmosphere. For sites that have a number of different lubricants, they can employ a color-coded system whereby lubricants of varying types are given specific parameters. For instance, all hydraulics could be labeled with a yellow triangle as well as the name of the product. It is very important to have at least three identifiable characteristics, in this case, color, shape, and name are used. Should an operator have an issue with being color blind, this should not implicate their choice of the wrong lubricant as there are two other remaining verifications.
Another critical note would be to ensure that lubricants are not left open and exposed to the environment. For those who have been left in this state, it is not advisable to use them in the equipment as many contaminants could have entered the lubricant while it was exposed. Often, rags may be used to “clean” the points of application or openings. It should also be ensured that these rags are clean as they can become a transporter of contaminants that can then enter the system. Some easy identification tips for lubricant deterioration can be seen in the image below.

Implementing proper storage and handling techniques can save your equipment and reduce unplanned downtime or production losses. These techniques are simple and not very costly to employ and they can significantly impact the overall production capacity of the entire system. It’s time to invest in implementing proper storage and handling techniques and help your site to become more reliable.
Thank you Sanya Mathura with Strategic Reliability Solutions Ltd for sharing this informative and educational series article with us!
Download our Oil & Grease Storage Best Practices Infographic for some tips to help outline the best practices for proper lubrication storage.
by Diana Pereda
We previously discussed in this series, Implementing Lubricant Storage & Handling procedures: Part 1 Understanding Contamination. In this follow-up blog, we will discuss the role of storage and handling.
As seen in the first article in this series, contamination is a huge factor that influences the degradation of a lubricant. The most common forms of contamination occur during both the storage and handling of lubricants. When lubricants are formulated they are typically placed in opaque containers (drums or pails). This helps to protect the lubricant from light sensitivity and UV radiation which can easily degrade the lubricant before it enters the equipment. As such, the lubricant would already have a decreased life span before being placed into service resulting in an even shorter maintenance interval for operators. Some IBCs (bulk storage containers) may not be fully opaque, so it is up to the user to help protect their lubricants and store these in cool areas out of direct sunlight.
Generally, most storage facilities may not have sheltered areas for their lubricants. In the case of drums, some operators store them upright on pallets, stacked a couple of pallets high and out in the elements. If one looks closely at a drum, one will notice two openings also called bungs (one is typically larger than the other). These have been designed to be opened and allow the lubricant to flow. If drums are stored outside, the top of the drum can collect water from the rain. When the temperatures get cooler during the night, the water is pulled into the oil through the bungs and contaminates the oil.
This phenomenon can be particularly detrimental if transformer oils are stored in this manner as the oil will now contain water. When poured into the transformer, it can cause a fire hazard because of the presence of this water due to improper storage. Similarly, for any oil stored outside in the elements, the presence of water can cause significant damage to the equipment.
If drums are to be stored outside, they should not be stored upright. In fact, they should be placed such that the bungs are at a 3 o’clock and 9 o’clock position as seen in figure 1 below. This way, if water surrounds the drum, the possibility of it entering the bungs (and by extension the oil is significantly reduced. Another way that drums can be stored would be on a drum rack, where they can be easily decanted or removed for use in other areas of the facility.
Understanding the handling of lubricants
While the storage of lubricants is important, their handling is often where most contaminants have the opportunity to ingress. On a typical day, if an operator goes to a pail/bucket to decant some fluid, they may use whatever container they can put their hands on and decant the lubricant. This container could already have some dirt, oil from a previous decant, or whatever may be in the atmosphere. With this one container, the operator has just introduced unwanted contaminants within the range of millions of microns.
One can think that the filters placed on the equipment should catch the dirt and some of them will capture some of the dirt particles but what about the contamination with a previously used oil? If the container was used to transport motor oil and then used to transport hydraulic oil, the chances are that the oil will be severely degraded very quickly. Motor oils contain around 30% of additives while hydraulics may contain a mere 5-10%. Either way, there could be major compatibility issues with both oils causing the oil to no longer perform its functions.
This contamination of using a previously used container to top up a hydraulic sump with approximately 3 gallons of oil, can result in the entire sump having to be replaced, including some downtime associated with cleaning the sump and removal of any traces of the contaminant. A decision that took less than 30 seconds just resulted in downtime which can cost millions depending on the type of operation. In the last part of this series, we will talk about ways to address storage and handling challenges. Stay tuned!
Thank you Sanya Mathura with Strategic Reliability Solutions Ltd for sharing this informative and educational article with us!
Download our Oil & Grease Storage Best Practices Infographic for some tips to help outline the best practices for proper lubrication storage.
by Diana Pereda
Often, when one thinks about lubricants and lubrication the main focus is on the actual lubricant and ensuring that it performs its intended functions. Typically, the storage and handling aspects don’t receive as much attention as they should. Oddly enough, these aspects heavily influence the performance of the lubricant and almost 50% of lubricant degradation occurs as a result of contamination. Contamination often enters the system as a result of improper storage and handling procedures.
What difference can a micron make?
A micron sounds incredibly small, so it shouldn’t make much of a difference to a machine, right? This is simply not true. Consider walking around with a small pebble in your shoe. It can move around your shoe easily and constantly maneuver its way around some tight places often causing the wearer some level of discomfort and distress! The wearer can’t wait to get the pebble out of the shoe because it should be there in the first place. Machines can feel the same way, except they can’t take off the shoe and knock the pebble out, they need us to help them with that.
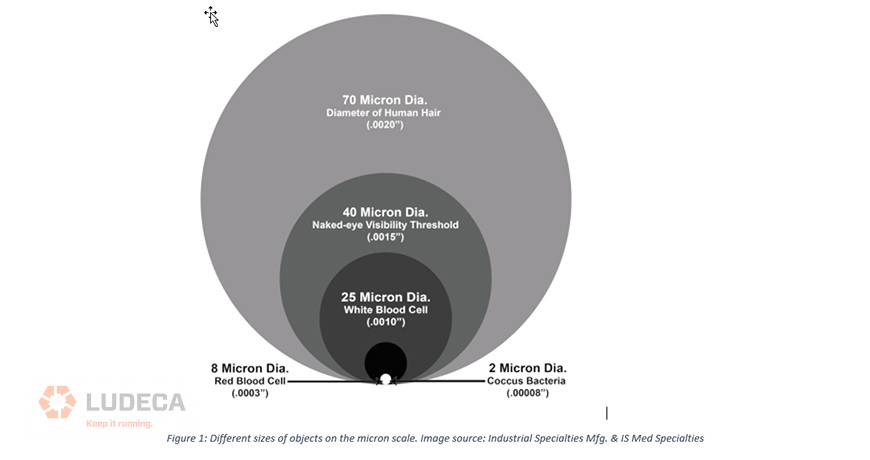
One micron is one-millionth of a meter. To put that in perspective, consider that the human hair is about 70 microns and the human eye can only see up to 40 microns as seen in figure 1 below.
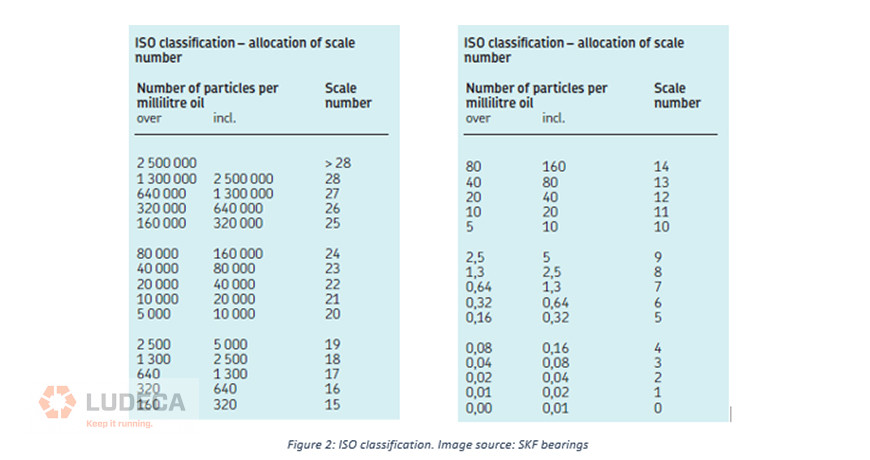
However, when reporting the cleanliness of a system the standard ISO 4406 is typically used. In this standard, a number is assigned to a particular range of particles present. As such, the reading of 22/18/13 does not mean that there are particles of the size 22mm, 18mm, or 13mm. Quite contrarily, these readings represent the designated range of particles which are ≥ 4 mm, ≥ 6mm, and ≥ 14mm. In this case, the reading of 22/18/13 represents:
20,000 – 40,000 particles ≥ 4 mm
1,300 – 2,500 particles ≥ 6mm
40 – 80 particles ≥ 14mm
Figure 2 below shows the ranges and scale numbers used in this rating.
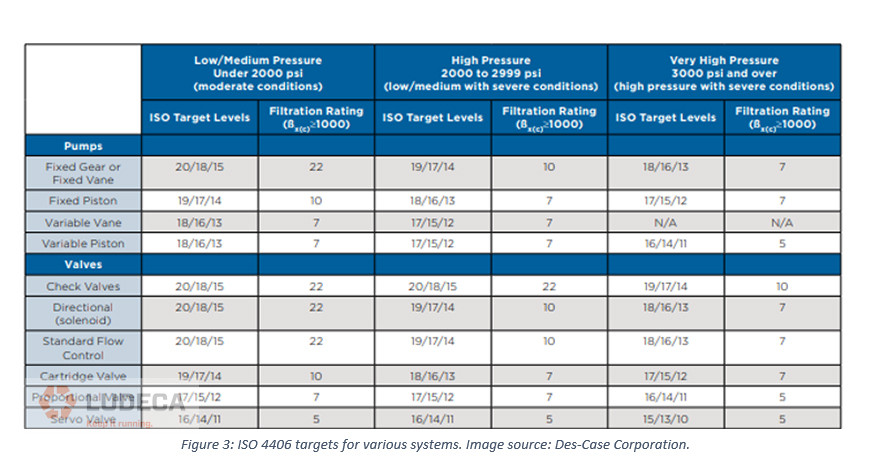
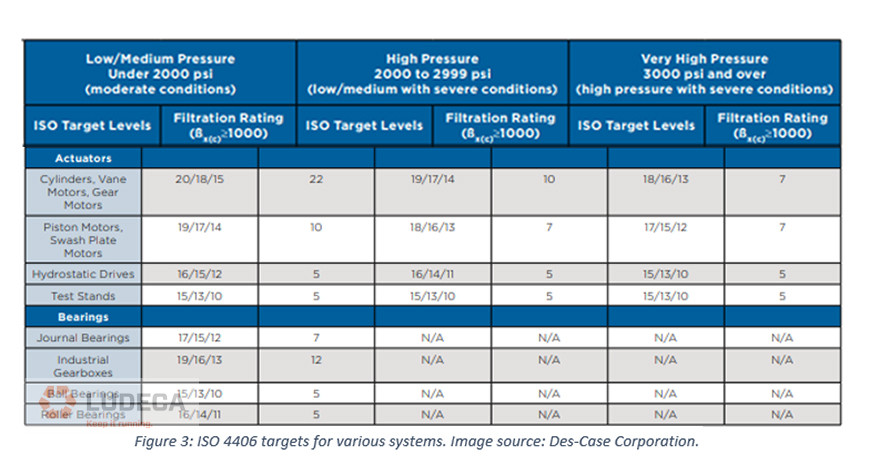
Unlike the example of the pebble in the shoe earlier, our machines have tighter clearances (especially those of hydraulic systems!). As such, contaminants can impact the system at the micron level. As per Des-Case, some targeted cleanliness levels can be observed in figure 3 below. Typically, if oils do not meet these requirements, then one can expect decreased pressure flows and eventual clogging of the system which can cause unwanted downtime.
Contamination and its effects
Contamination in any form is unwanted. Contamination or contaminants can be defined as any foreign material which enters the system. This can be broadly classified into gases, liquids, and solid materials. Once foreign material enters the system, immediately the system will become compromised as this was not the intended design. While there may be some contaminants that will not impact the system negatively, there are those which can cause the detriment of the system. When considering the lubrication industry, contamination mainly occurs during the storage and handling phases before the lubricant has entered the system.
Interestingly, contamination is classified as a mode of degradation. Contamination can be the root cause of other degradation modes. For instance, if micro dieseling is occurring then this is due to the ingress of air bubbles which can be thought of as foreign material to the system. If we think about another degradation mode namely additive depletion, this may occur due to a contaminant being present that successfully bleaches the lubricant of a particular additive. Even in the case of oxidation where free radicals are produced, if these are produced as a result of a contaminant entering the system, then contamination is the root cause of degradation in this special case.
Essentially, the effects of contamination must be understood before implementing any storage and handling practices. This allows users to become more aware of the actions or inactions which are taken on a regular basis. The effects of contamination can be quantified and used when convincing management to implement storage and handling procedures. Simply quantify the amount of downtime spent for equipment which have suffered a breakdown due to contamination and include the number of hours spent to repair the issue and if any parts were used. The final figure can be quite surprising and will get the attention of management. Stay tuned for the second part of this article where we discuss the role of Storage and Handling.
Thank you Sanya Mathura with Strategic Reliability Solutions Ltd for sharing this informative and educational series article with us!
by Diana Pereda
We previously discussed in this series, Environmental Compliance Through Efficient Work Practices: Part 2. In this blog, we discuss goals for efficient work practices like bearing lubrication and fan pitch/balance.
Upgrading tools and introducing more complete training should be part of any company’s operating plan, so we will see how much impact can be made by implementing solid information and work techniques that can impact the output of the machines, the reduction of stress of maintenance, and the achieved realization of environmental compliance.
Fan pitch/ balance
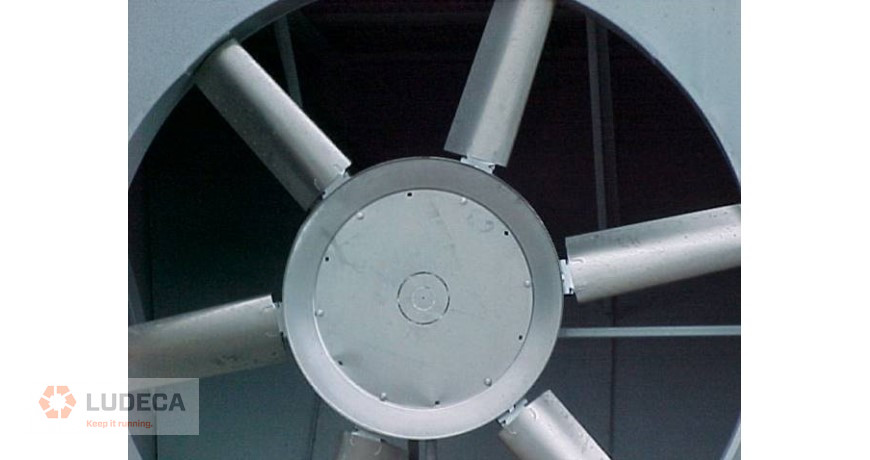
Part of a belt-driven system can be a large cooling fan. With blades as large as a 10-foot radius, and the ability to pitch those blades for a given installation, it is possible to consume 100-150 Horsepower to run this fan. Often, little information is given to the installation tech on how to properly adjust these blades. Some of the specifications are actually tighter than understood. For example, certain manufacturers state a maximum pitch rate of 14 degrees, or the fan may cause cavitation at the end of the blades. This means that the fan is consuming extra power to turn a massive pitch, but not really moving air efficiently. Having the specifications for proper blade angle and setting it with a calibrated digital level can ensure that the horsepower consumed by the fan is not wasted. And at the scheduled services, it is important to check the balance of the fan assembly. The build-up is common on equipment that is run continuously and should be cleaned off. Another common practice, in colder months, is to tarp off part of the airway that leads to these fans to prevent freeze-ups. This was common practice years ago but should be discouraged with the advent of proper louver adjustments. The tarps can load and unload the fan in ways that encourage High Cycle Fatigue, which can destroy a fan in catastrophic ways.
Bearing lubrication
These systems have multiple components that receive power from the engine, driven by the belts mentioned before or by auxiliary shafts. These components have bearings, which require the addition of lubricant. The common practice is to pump in a stated amount of lubricant at set intervals, whether or not the asset needs it. In some cases, the need for additional lubricant has long since passed and in others, there is already too much lubricant in the bearing. Either situation causes permanent damage to the bearing. Using Condition-Based technologies (like an SDT 340 or even the SDT LUBEChecker) can determine if lubrication is needed, and when to stop adding.
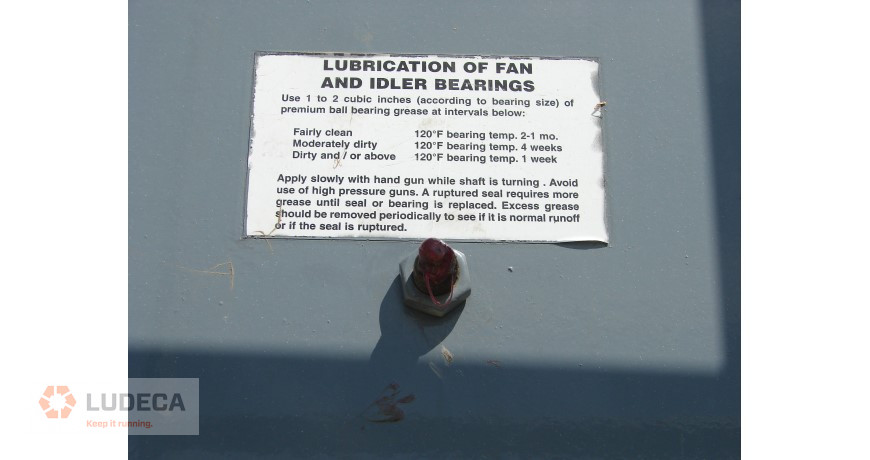
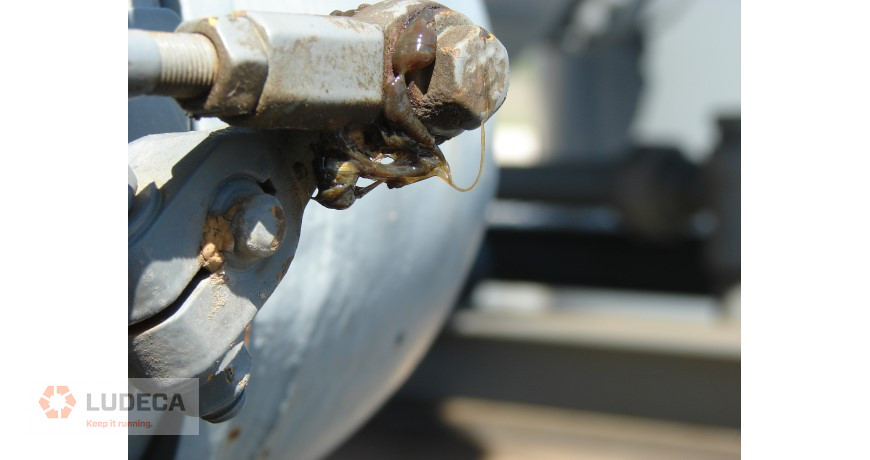
Any one of these practices can help reduce the environmental impact of running the industry’s current crop of assets, without any major retooling or large capital infusions. It will also pay dividends by making the service life of the parts and components last longer, while allowing the technicians to find problems and eliminate them at inception, instead of facing some of the major failures that occur when outdated practices continue without question. By staying in compliance with the regulatory agencies and having the documentation to state how equipment is being maintained, the cost saving should be easy to spot the next time investors and executives meet to discuss how those lofty goals are being met.
by Diana Pereda
Inspection Technique
Greasing of bearings using ultrasound, often described as best practice, helps us understand how much grease needs to be applied. Ultrasound is a good measure of friction – too little or too much grease in a bearing produces elevated friction levels. Using ultrasound, the right quantity of grease is determined by assessing the levels. SDT LUBExpert ensures that the right quantity of grease is applied to each bearing using ultrasound, condition-based lubrication.
The Ultranalysis® Suite 3 software also provides a means of storing valuable lubrication data, trending and traceability where grease replenishment quantity, intervals and ultrasound levels are recorded. Information stored in this database may also be used to optimize lubrication schedules/intervals and for root cause failure analysis. The LUBExpert also facilitates basic screening of bearing condition using the ultrasound crest factor algorithm.
After having conducted numerous trials on a large volume of grease lubricated bearings from various plants which were previously greased using fixed replenishment rates calculated from grease application formulas and/or calculators.
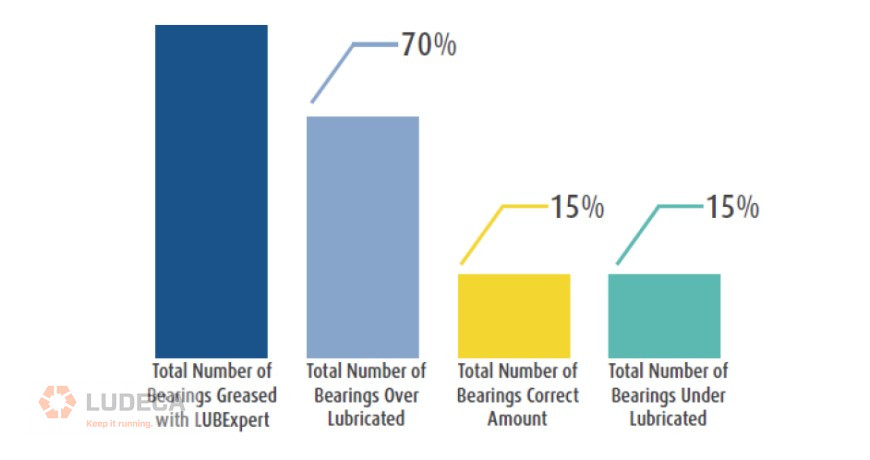
In one example, using ultrasound (LUBExpert) to determine correct quantity of grease, the study indicated that approximately:
- 70% of bearings were being Over Lubricated;
- 15% of bearings were Under Lubricated; and,
- 15% of bearings had the correct replenishment rate.
Results obtained from this trial were similar to results obtained from other plants.
Results
Conclusion
The greasing of bearings is tailored to the condition of each bearing rather than relying on fixed / calculated quantities condition-based lubrication. Greasing using ultrasound:
- Improves equipment reliability and availability by ensuring the bearings receive the correct amount of grease;
- Information collected and stored in the lubrication database facilitates further optimization of lubrication schedules and reliability programs;
- Reduction in grease usage and optimization of schedules has costs savings implication.
Thank you SDT Ultrasound Solutions for sharing this informative article with us!
Related blog: Are You a One-Shot Bandit?
by Diana Pereda
We previously discussed in this series, Do we really need Oil Analysis if We’re Performing other CM Techniques? – Part 1. In this follow-up blog, we will discuss reading the oil analysis report.
Part 2 – Reading the oil analysis report
An oil analysis report can seem like a lot of numbers and colors all jumbled together for those who may not be familiar with it. The basic element of all reports is that they provide the values seen in your equipment and compare them to those given by the OEM or seen in the field. Some labs provide the reference values while others just stipulate whether they are either within the limits or outside of them. Labs may also provide some advice on courses of action to get help return the oil to normal values.
Oil analysis reports are similar to blood test reports, there are a lot of values and limits but only when we can interpret them properly do they actually make sense. For instance, if the blood report stated that the cholesterol levels were getting into the warning range, we can then adjust our diet and lifestyle to help reduce these. Similarly, with the oil analysis tests, based on the values in the report, we can inspect the machine for evidence of wear or schedule some preventive maintenance accordingly.
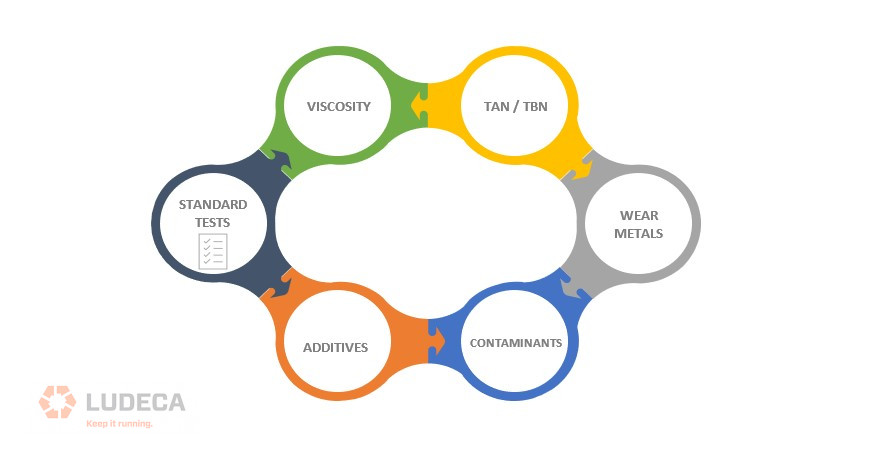
Standard tests within the industry are those which give an overview of the overall health of the oil. Typically, this measure the oil’s viscosity, TBN/TAN, presence of wear metals, contaminants, and additive packages. These properties can guide the user to understand what is happening in their equipment and possibly perform corrective actions before the asset reaches the failure point (on the P-F curve).
The oil’s viscosity is usually measured using the ISO grading system. In this system, the actual viscosity of the oil is placed within a grade. For instance, an oil with a viscosity of 63cSt or 73cSt will be classed as an ISO 68 oil. Thus an ISO 68 grade doesn’t necessarily translate to an oil with a viscosity of 68cSt. With the ISO grades, they have a range of +/-10%. The range for an ISO 68 oil lies between 61.2 CST and 74.8cSt, if it falls out of this range it is no longer classified as an ISO 68 oil. A good reference value for used oil is a change of +/-5% which can determine whether degradation has occurred or not.
The TAN (Total Acid Number) or TBN (Total Base Number) values depict the amount of acid which is being built up in the oil. Engine oils have TBN values while other industrial oils have TAN values. In engine oils, a decrease of approximately 50% of the TBN value is a cause for concern. Any type of acid within your system is not good and a decrease of the TBN by 50% means that the acid level has increased by the same amount. On the other hand, an increase of 0.2 mgKOH/g is a cause for concern in other oils.
The presence of wear metals indicates that there is some form of wear occurring within the equipment. Depending on the type of wear metal which has been detected, one can pinpoint the source of wear. For instance, if the levels of chromium keep increasing in the oil analysis reports and the asset has chrome rings then the source of wear could be isolated to these rings. Thus during maintenance, they can be inspected for wear. Different OEMs have varying values for their equipment especially based on the environment in which they operate, so the best advice is to follow their guidelines or those of the lab for this equipment.
Contaminants are the bad actors which can cause major problems. Just like a pebble in your shoe, contaminants can cause a lot of misery to the equipment it affects. This is particularly important for hydraulic oils where contamination is a huge challenge especially due to the small clearances in this type of equipment. Most OEMs have guidelines on the amount of tolerable contamination for their equipment.
Additives are sacrificial in that their main purpose is to be depleted. However, when this depletion begins at an accelerated rate, that’s when they may no longer be protecting the oil. This is where most of the issues begin. While Oil manufacturers don’t give out the ratio of the additives in their blends, it is always a wise idea to perform oil analysis on a new oil sample and use this as your reference for all the other samples.
These properties help to determine the health of the oil. Thus, by monitoring them, we can get a better picture of what is happening inside the equipment. Remember, changes in the oil are a reflection of what is occurring within the equipment. For instance, if the TBN value drops drastically by 60% or more within one week of the oil being in the equipment, this can indicate the presence of fuel dilution. If the viscosity has also decreased significantly with the 60% decrease in TBN then a possible cause can be fuel dilution. This is the importance of trending the data along with the various properties so hypotheses can be made and then verified through checks.
While these are just some of the standard tests, specialty tests also exist when we’re trying to determine other factors. For instance, in turbine oils, if the viscosity levels are a bit higher than expected or the additive values have dropped to a concerning level, operators may want to investigate the presence of varnish. Varnish can be detrimental to the equipment as it causes a lot of unplanned downtime. Deposits can stick to the insides of the equipment and insulate heat causing equipment temperatures to rise outside of the operating ranges.
The two main types of test to be done for varnish would include; MPC (Membrane Patch Calorimetry) where the oil is passed through a patch and a value is given based on the patch intensity. This can tell us if there are deposits in the oil or varnish pre-cursors. The next test would be the RULER (Remaining Useful Life Evaluation Routine) test which gives a quantitative value of the remaining antioxidants (both primary and secondary) for the oil. This can tell us if oxidation is present and whether the antioxidants have significantly depleted or not. In part 3 of this series, we will talk a bit more about the other types of condition monitoring techniques as well as the method for selecting the best one for your equipment. Stay tuned!
Thank you Sanya Mathura with Strategic Reliability Solutions Ltd for sharing this informative and educational article with us!
by Diana Pereda
Part 1 – Understanding the consistency of oil Sampling
Oil analysis has been one of the most widely used Condition Monitoring (CM) techniques to observe any changes occurring internally in the equipment. Typically, it is one of the most basic techniques utilized within the industry and is viewed as the first line of defense to detect any abnormalities. However, is there a need for oil analysis if the team employs other CM techniques which can also detect changes within the equipment?
In this trilogy, we will explore these main concepts:
- Understanding the consistency of oil sampling (Part 1)
- Reading the oil analysis report (Part 2)
- Selecting the best CM technique for your equipment (Part 3)
Oil Sampling – Consistency is key!
Let’s think about a turbine system and taking a sample from one of these systems. A gas turbine may be connected to compressors, gearboxes, and other small assets. Thus, if we’re trying to monitor the internal condition of the turbine, we need to ensure that the sample we obtain is representative of the system. As such, it is critical that a sample is taken from a turbulent area (or an area that is not a dead zone). Samples should also be taken upstream of the filters (this ensures that any debris or contaminants are not filtered out and can be examined) and downstream of components.
If we are sampling from a closed-loop system, we need to remember to label the sampling points and ensure that the samples are taken with consistency. Data trending is one of the main aspects of oil analysis. When reading oil analysis reports, it is usually compared to the last report/s to determine if there was any progression of contaminants, wear metals, or even additive packages. Thus, if someone samples upstream of the filter and component for one sample but then samples downstream of the filter and component for the follow-up sample, there can be a big difference in the results leading to misconceptions about the condition of the equipment.
How often do you sample?
While consistent sampling is important, determining the frequency of sampling is also critical. There are a couple of factors to consider when calculating this frequency of sampling, namely;
- Aim of the program
- Criticality of the asset
- Type of test/oil
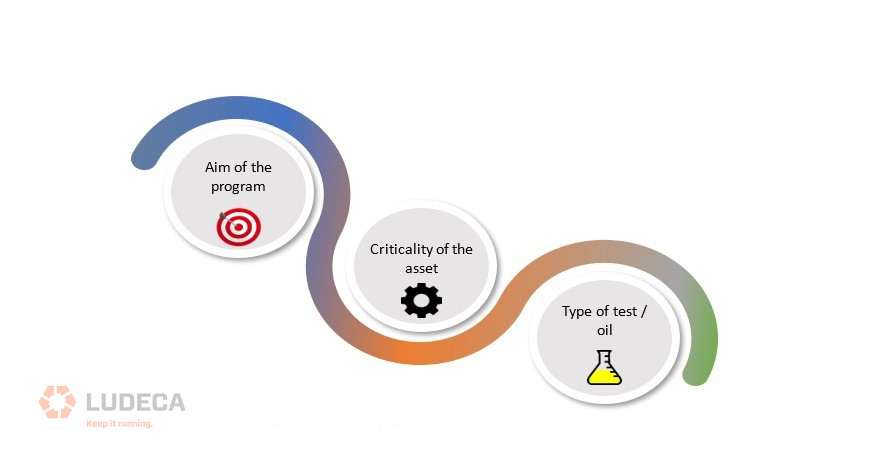
The most important factor to consider is the aim of the test. What are we trying to establish, trend, or prevent? When we fully understand this, then this provides us with the purpose of the oil analysis program. This allows us to then tailor a program suited for the assets within our plant or facility and to determine whether continuous monitoring is needed or if sampling should be done at a specified frequency.
Criticality of your assets
The criticality of the asset helps us to determine the frequency of sampling and the types of tests that need to be carried out. Assets can be classified into critical, semi-critical, and non-critical. Critical assets are those which can cause a significant impact on the plant or facility. The type of impact can vary depending on the factors which are important to the plant. Some plants may hold production as an important factor while others may hold the availability of their equipment for service as their important factor, others can hold both or many others. Sometimes, these can also be tied to the KPIs (Key Performance Indicators) of the plant.
For critical assets, samples should be taken monthly or even bi-weekly depending on what the user is trying to find out. Let’s take a gas turbine as an example. At start-up, if we wanted to monitor the rate of antioxidant depletion or the rate of degradation of the oil, we could test the sample on a bi-weekly schedule for the first two months and then move the sampling to a monthly, quarterly, or even semi-annual schedule once it goes into operation. This is also dependent on the results we get from the sample.
Semi-critical assets are those which do not significantly impact the plant. For instance, if these go down, the plant can still function but at a lower capacity. This does not mean that they are of lesser importance. It simply suggests that the frequency of sampling for these semi-critical assets would not be the same as for critical assets. On the other hand, the non-critical assets are those which do not impact the plant if they shut down. Typically, these are the secondary pumps or equipment. These assets will have a lower sampling frequency than the semi-critical assets. The criticality of the asset should be assessed before determining the frequency of testing.
The types of tests also have a role in determining the sampling frequency as there are some tests that require 24-48 hours to be processed before a result is given. Typically, these tests are slightly more expensive and designed to measure specific properties which may not degrade at a very rapid rate. These specialty tests are usually done quarterly, semi-annually, or even annually such as RPVOT, RULER, and MPC. They also require a larger volume of oil samples which makes it difficult to obtain from those smaller equipment sumps.
When determining the oil sampling frequency, a matrix can be used to help rank assets as per criticality. These assets can also be classified according to the type of oil test they require and if any specialty tests may be needed. Determining the frequency of sampling is just one aspect of having a successful oil analysis program. The next factor is actually reading the results and making maintenance recommendations for the assets. Stay tuned for part 2 when we take a deeper dive into reading the oil analysis report.
Thank you Sanya Mathura with Strategic Reliability Solutions Ltd for sharing this informative and educational article with us!
Related Blog: Equipment Criticality Ranking Tip
by Diana Pereda
We previously discussed in this series, Acoustic Lubrication Implementation – Part 3 – 4 Tips to Assemble the Right Team. In this follow-up blog, we will discuss The Right Data.
“Opinion should spark your ideas, but data should direct your decisions”
I promised it is time to touch technology in Part 4. Well, I lied a little. Let us delay pressing buttons for a moment because there is an important job to do before that, like take data in your hands and make the correct action plan. I am sure that by now you have a clear picture, a clear idea about your target, the vision of achievable benefits, and an excellent team. That’s just great, but you need to back it up with data. You also need to move from where you are right now to where you want to be, and for that, you need a plan.
To make an effective plan–you need data.
With no intentions to sow pessimism, but only being completely honest from this moment on, every single thing can go wrong if you become overconfident. Not a time for a victory lap yet. Get data.
Evaluate your current practice
- What is being done?
- Where is the evidence that it is good or bad?
- How does it affect assets?
- What is the outcome of current practice?
- How are decisions made?
- Who makes them?
- Who is responsible?
- Who is in command?
- How do communication channels look like?
- Is there a discipline,
- What is the interconnection between departments: Lubrication, Purchase, CM, Maintenance, Reliability, and Operations.
There are two main reasons (among others) to do this:
- The change will be effective and optimized only if you know what exactly needs to be changed and why. That is not a matter of opinion, it is a matter of data
- You need to establish starting point with crystal clear evaluation in all languages – downtime, spare parts, maintenance hours, overtime, unplanned work, product quality issues, missed delivery target issues, and money. Only with a clear starting point will you be able to create useful leading and lagging KPIs to steer your journey
Set up a clear goal
You need to know where you want to go. What is your target? As much as it seems painfully clear, do not get lulled by thinking that it is so obvious, because it is not. Specific industries in specific companies in specific situations can have a completely different set of goals that do not necessarily align with what your opinion tells you. What is the target of your organization? Will your activity bring your organization closer to that target and how? Zero lubrication-related failures is an excellent goal, but how exactly does it serve business targets? Get the data that connects your zero lubrication-related failures and business target and out a number on it. That very number, that should be your target, that is what you can do for your organization.
Using the same metrics as in current practice evaluation is a good way to do it as it can be easily compared and monitored, but still, connect it with the business target. Be very specific with data.
Identify gap value
In simple words, gap value is evaluated differently between your current practice and your goal. This is exactly the value of your initiative, the added value. Call it a business opportunity. Your program will do “that”, is “that” enough? Does “that” justify investment and effort? Is it worth doing?
I think it is, but that is an opinion. Get the data, numbers. Note that there ARE situations when even the best initiatives do not bring an actual added value to the organization. If there is no value, there is no point in activating the program. If the value is not identified, it does not exist, as simple as that. Once you have your data in your hands; when you have exact added value expressed in business targets terms, you can sell your program to top management with all dots connected.
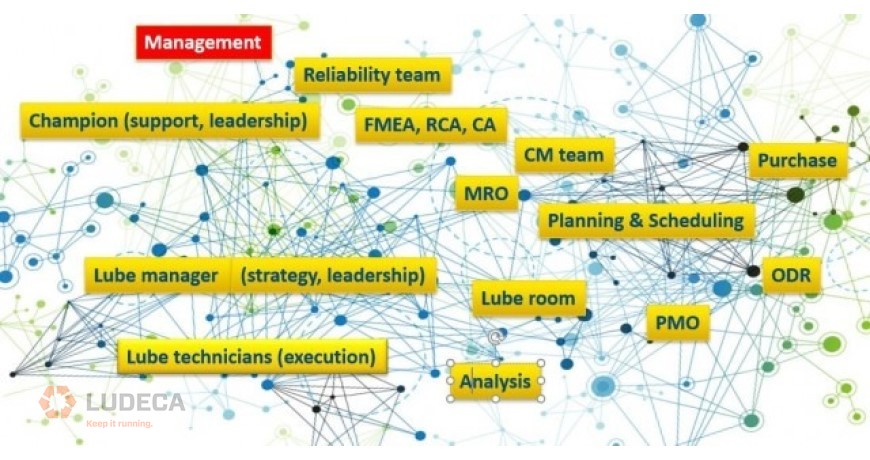
Collect asset data
- Identify your assets – The first step is to collect data from your master asset list and familiarize yourself with it
- Perform FMEA, RCA, CA, failure history – This is a highly important and valuable step that will give you a “medical record” of your asset. Each following step needs this data. What will be your data collection interval? what failure modes are there? what are their symptoms? what about consequences, likelihood, what is history data telling you? how often lubrication comes up as the root cause? what about bad actors? This step tells you what needs to be done, when, and how. All mentioned data is probably in hands of a Reliability engineer, some in hands of Condition Monitoring. In case those two departments do not exist, you need to do it yourself.
- Set priorities – medium, high, low – The outcome of the previous task will give you priority from a Lubrication standpoint. Although you should focus on high criticality assets immediately, it would be a good idea to make your first steps on medium criticality assets. Give your team a chance to “warm-up” and get confidence before putting high responsibility on their shoulders. Call it a “soft license to fail” and move to high criticality after that.
- Tightly cooperate with CM Team – The flow of information between Lubrication and Condition Monitoring is more than interdepartmental communication, it is an essential need, natural symbiosis.
Getting the right data, a step I roughly explained here, makes your future activities focused on the right things in the right way. Following opinion and passion often leads to frustration because reality is much different than what we would all like to do. Your resources are not endless, on the contrary, they are very limited, and you need to be very careful how you use them. Time, people, tools, they all need to be sent to the battles where rewards are highest. That is how value is added.
Watch our 5-Step Acoustic Lubrication Procedure motion graphic for an effective way to grease your bearings right and brings you one step closer to best practices for your lubrication program.
Thank you Haris Trobradović with SDT Ultrasound Solutions for sharing this informative article with us!
by Diana Pereda
We previously discussed in this series, Acoustic Lubrication Implementation Part 2 – 7 Diagnosis To Get You The Right Mindset. In this follow-up blog, we will discuss The Right Team.
“Environment Shapes Behavior”- Jacque Fresco
By now you got the big picture and right mindset, now it is time to gather the right team. It would be nice to write here that it is all okay and easy, nothing to worry about, but that would not be true. There is a lot to worry about, a lot of things can go wrong, and it is far from easy. Honestly, it can be a nightmare. Engineers are trained to work with machines and technologies and that works just fine. But now it is about people and that requires an entirely different set of skills. Not much of it is measurable, not much of it is tangible, and almost nothing is predictable. It is about people, their emotions, motivation, personal interests, personal life, and let’s be honest, engineers are rarely trained to deal with that. Mistakes done at this stage can ruin even the best strategies and plans in no time. The frustration may drive you to the point of giving up. It happened, it is happening, and it will happen in the future.
Let us move outside our industrial environment for a moment. Imagine you are planning a trip with a small sailboat somewhere in the beautiful Adriatic Sea. You have room for a team of five or six people to join this adventure. At least twenty of your friends know how to sail, at least they are familiar with the basics, and if they are not so confident, you can easily teach them. How do you whittle down your team from twenty to five? What matters? Sailing skills only? I don’t think so. Let me mention what might matter to me.
Mentality is very important.
Do I want complainers or easy-going people? Being a team player is very important, desire to take that trip matters a lot. Is there a passion? Getting along with other team members also seems to be important. Let us go further, troubled personal life? Picky about food? Cannot handle a beer or two well? Snores? Personal hygiene issues? Are they lazy? Do you see how deep in detail we go when choosing our friends to join our journey? Technical sailing skills are secondary. It is a journey after all and you will spend a lot of time together.
Your lubrication journey is not much different; maybe slightly more complex. Instead of a group of friends having fun because they choose to, you have a group of people doing their job eight hours a day, apart from what they do for fun in their private time.

Here is another scenario to consider. Imagine you are rowing an eight-seater; like Oxford and Cambridge compete since 1829 (on annual basis since 1856). Strength and stamina are hugely important, of course, but how do you actually choose the team? What matters? Strength and stamina only? Again, I don’t think so. Imagine the amount of time they will spend together and everything they must do to prepare, and eventually win that race.
The same questions apply for mentality, being a team player or not, desire, passion, complainer, troubled personal life, picky with food, cannot handle a beer or two, snores, personal hygiene issues, and laziness.
Observe the depths we must go to when assembling a team. It seems that strength and stamina are secondary to likeability and compatibility. They say if you must choose between a guy who will row out of pace with the team and one that just does nothing, the latter is better.
If seven are rowing and one just sits still, you are at 87.5% of the expected power. If eight out of eight are rowing, but one of them is out of pace, your efficiency could drop to 75% or less (not mathematically correct but my point is illustrated). Choosing between two bad possibilities, it is better to have weaker, aligned teammates than stronger, misaligned teammates. These two examples illustrate how it affects you in small, silent steps or in one short sprint. Both scenarios result in destructive outcomes. So, let us make sure we don’t need to choose between two bad options. Aim for 100% and set your team well.
You see, it is complex, it requires your full attention, and all your leadership skills to do it right. Right for your organization, right for you, and right for all your team members.
1. You – Be a leader, not a boss
This is easier said than done as many people do not really understand the concept of leadership as opposed to being a boss. As a boss, you give commands to your subordinates and they are expected to execute them. This might work if you are an absolute genius who has absolutely everything under control. But, if you are able to do all that by yourself, why do you need a team in the first place?
As a boss, you own someone’s time, 8 hours a day, and normally, that is all you get. Leaders get much more; culture, involvement, ownership, initiative. Leaders get the whole package. As a leader, you serve others to become better. You improve your most valuable assets – people and the improvement of the entire system happens much faster. In addition to serving others, you take full responsibility for their actions. It is not easy, but it is rewarding.
This is certainly not a lesson about leadership, but some of the tips could be handy. Forget about using authority, use passion. One of the most important members of your team is probably your boss, a person in top management that supports your program. Quite difficult to be bossy to your boss, right? Transfer your passion and your beliefs, explain and train, listen and show respect, motivate, do not micromanage, translate goals to each team member in a language they accept. Values, beliefs, behavior, and rituals, culture. That is your first task to create within your team. The benefits of technology will grow just fine in that fertile soil.
2. Team – MUST-ers vs. WANT-ers
These are not English words. They are invented to better illustrate what I often see. People get assigned to certain tasks and their superiors send them to join the team. So they MUST. You can easily recognize a MUST-er, that is the guy playing solitaire on his smartphone during the training. You are wasting each other’s time, and it is not his fault. It is probably your fault or the fault of the person that sent him. MUST-ers were not born that way, the system creates them. Bosses do this by forcing people to do something they do not understand or have no interest in, they will never do the job right. You don’t want MUST-ers in your team because sooner or later, they win and you lose.
Try the other way around. Promote your program, promote the idea, talk about it, share knowledge, share your plans. You need to hear yourself to be sure you understand it. Listen and recognize those who react to your passion with their own passion, and there you will find your teammate.
MUST-er, in a best-case scenario, becomes a DO-er. WANT-er becomes a THINK-er. You need thinkers.
3. Fans – Fence-sitters – Naysayers
Once you recruit your team from the fans group, the job is not over. Two other groups: Fence-sitters and Naysayers are there with you as part of your organization, doing their job. There are ingredients you need for your program:
- Proper reasons why yes – to make sure you understand
- Proper reasons why not – to understand what others don’t understand
You need both, keep that in mind. People often get tempted to do something about fence-sitters to “convert” fence-sitters and to fight against naysayers. Don’t do that.
Fence-sitters are those that will just stand aside and observe, they will never convert. Their plan is to stay safe, they have an opinion but choose to be silent and avoid risk. Cowards? Maybe, but that is irrelevant. Given the choice of reaping a potential benefit versus taking a risk and maybe reaping no benefit, they will always choose the safest, risk-free path. You can explain all you want, but they will not change. Because it is not about understanding, it is about their mentality. Their plan is simple and effective; if you succeed, they will hug you and say, “I believed in you from the beginning my friend.” If you fail they will say, “I told you so!”
Ignore them, don’t waste your time and energy.
Naysayers are those that openly oppose your ideas and your program, they say it loud and clear and offer their reasons why. Are they enemies? No! They have an opinion and they have the courage to express it. You need to respect that. If you fight against them, you recognize them as enemies, but there is a better way. Learn from them! Having a strong opponent is a blessing. Their position and the fact that they are saying it loud and clear is exactly what you need to understand the situation completely.
Listen to reasons why not, that tells you what others don’t understand. One of the ingredients, remember? Keep them close, keep listening to them, they are highly valuable opponents, not enemies. Not to be ignored or argued with, they might be right, they might even teach YOU something. They will make you better.
4. Me working on YOUR project vs. MY small private project
Translate goals to organizational, departmental, and individual. Those languages are different, so translate carefully! Slice your strategy in elements down to the individual level.
Now, with clearly translated goals and sliced up strategic tasks, create a private micro project and assign one to each team member. Make it personal – credits, responsibility, rights, and obligations. Avoid feeling that they are working for your project as people are better when doing their own project, so define it clearly. By doing this, you create leaders, and that is your value as a leader.
Seems that you are surrounded by friends that think like you, carefully listening to colleagues that don’t think like you, ignoring those that have no courage to express their opinion. That is a good place to be.
Your team is a group of leaders, running their own micro-projects with pride, taking credit for success, and taking responsibility for failures. Not blaming – helping, not grandstanding – sharing. If you are in this position, you are already successful, you created a family. I personally work in one. It’s time to put the technology to work.
Download our Ultrasound Lube Technician Handbook to learn how to improve reliability and save money with ultrasound by making lubrication a condition-based task instead of a time-based task with your teammates!
Thank you Haris Trobradović with SDT Ultrasound Solutions for sharing this informative article with us!
by Diana Pereda
We previously discussed in this series, Acoustic Lubrication Implementation – Part 1 The Big Picture. In this follow-up blog, we will discuss The Right Mindset.
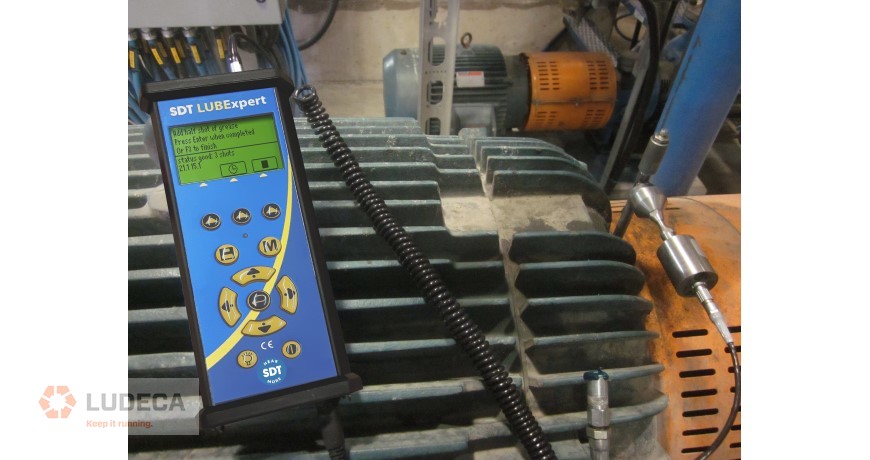
“MAN CANNOT THINK OUTSIDE HIS CULTURE”- JACQUE FRESCO
To lay the foundation for implementation, the right mindset and culture must take top priority. Both technology and skills need a fertile environment to bring benefit. “Change” is obviously the critical word, not only in lubrication but in every aspect of our lives. As Heraclitus said, “Everything changes except change itself” translated to present-day industry terminology, “If you are doing it the same way as last year, it is probably wrong.”
Changing culture and getting the right mindset certainly involves asking a lot of questions and accepting answers, even when those answers are painful. Painful answers are helpful answers. Correct diagnosis is a necessary step to prescribe treatment. Here are some questions, some quite obvious answers, and diagnoses that might help.
Look at the fact that between 40 and 80% (depending on industry) of bearing failures are rooted in lubrication. These statistics have been around for years, they are everywhere. Yet it seems that some accept them as “normal.” Just to be clear, it is not about 40-80% of the bearings themselves, their price in this story is irrelevant. It’s the 40-80% of downtime, work hours in repair, overtime, middle of the night phone calls, collateral damage, lost production, lost clients, poor quality, urgent work, urgent spares shipping, and poor safety during urgent work. We can even be more pedantic and look at how much energy we waste to overcome increased friction. It’s an interesting amount with lots of decimal places. By comparison, the cost of the bearing itself is negligible. Why do we accept that?
Diagnosis 1: No dollar value assigned to the problem. No price – no problem – no problem – no solution
When we ask our audience, “how important is lubrication on a scale of 1 to 100?” the usual answer is somewhere between 98 and 100. Excellent! It is absolutely clear that lubrication is a top strategic priority, but what happens when we make the question more personal? “How many of you dream that your children will one day become a grease guy?” Here, the usual answer is somewhere between ZERO and ZERO, and a lot of people cast their eyes uncomfortably to the floor. Why? Because it is a “dirty, poorly paid job, that requires no education and everyone can do it.” Do you see the problem? A noble and highly important profession degraded for so long. Considering the answer to the first question, one would assume that only the best of the best of the most highly trained and specialized people in each organization would be authorized to walk around with a grease gun. But it is not so and that is quite a paradox. Turning our heads to the problem does not make it go away. Ask yourself this simple question, “Who can destroy reliability fastest?” The answer is probably the person who can also improve it, at least by not destroying it. When you think about the answer, keep in mind that your lube tech is the one who has the most intimate, closest relationship with your rotating assets. He is the only one to put something inside. Give me 10 minutes and a grease gun and I can destroy 10 electrical motors. Your lube tech can do it too…or not.
Diagnosis 2: Lubrication as highly important activity – DECLARATIVELY only
How and who is involved in our lubrication practices? There is a lubrication chain in place, whether you create it or not, it is there. If not created properly, the chain will create itself poorly. Both good and bad lubrication chains consist of:
- Management – strategic decision-makers
- Lubrication engineer/strategist – builders of the program
- Lubrication technicians – aka grease guys execution level
These three links create the chain and each of them is EQUALLY important. When there is a lack of awareness or involvement at any of these three links, the results are disastrous. Wherever the chain breaks, bearings pay the price and the grease gun becomes a machine gun. Most bearings do not just fail – they are executed. The lubrication chain can fail in many ways, mostly when fine fibers around them are missing. Those fine fibers are awareness, ownership, communication, discipline, control, responsibility, and recognition. When fibers fail, all connections are lost. Management doesn’t hear, lube manager doesn’t see, grease guy doesn’t speak, and communication breakdown leads to a total lubrication collapse. It does not happen as an explosion, it is slow, silent, and painless. It simmers slowly and nobody reacts until they are surrounded by ruins. No lubrication excellence can be achieved if even one of the fibers is missing. The chain disintegrates.
Diagnosis 3: Lack of awareness/ ownership/ communication/ discipline/ control/ responsibility/ recognition
Why do we do what we do? What proves it correct? Even in a broken system, someone is doing something. Bearings are being greased (probably) so there is a system, and we even call it a strategy. A bad strategy, but still it’s present. There are many strategies out there, from real nightmares to relatively disciplined but not precise ones:
- “No approach” approach: The “No approach” approach is actually very popular. This means that someone sometimes goes around and squeezes some grease. And sometimes not. It is not even clear who that guy is.
- “Feelings-based” approach: The “Feelings-based” approach is also very popular. There is always someone who has a good feeling for it and he is the only one who, by some kind of magic given by higher power, “feels” when bearings need grease and knows how much grease to give.
- “Friend told me” approach: The “Friend told me” approach is out there much more than one might expect. Two friends, they were university campus roommates, worked in the same industry but different companies. One of them has a lube plan that works fine for him and of course, shares the plan with his friend. Nice gesture, but it never works. Machines are like humans, unique in so many small details yet with circumstances constantly changing.
- “Time-based” approach: The “Time-based” approach is widely used because it seems so simple and easy. First, it is a release from liability, “It is not my fault, the formula told me so” Second, it is an effective lullaby; calculation is here, execute it, and that’s it, forever. We know there are many different factors impacting the calculations; temperature, load, speed, vibration, humidity, contamination, start/stop operating regime, and variable operating conditions. I personally believe in formulas, but I also believe that outcomes directly depend on the accuracy of input data. The data represented as operational correction factors are mostly assumptions based on estimates. While the formula may be scientific, the data is only a best guess, but scientists don’t guess. These assumptions produce huge errors. Should we lubricate in one month or nine months? Depends on how well you guessed. Both numbers can be defended as mathematically correct, and both have nothing to do with the real needs of any particular bearing. Too often we see replenishment intervals inscribed on motor plates as 2786 hours or 3125 hours, and a suggested quantity of 37.6 grams. It is so strange that nobody asks questions like, “Well how do they calculate it so precisely?” or “How do they know about humidity in my area?” they don’t. Calculations are done based on what should be a reality, there is no intent here to make accusations. Those calculations are done with the best intentions and within the limits of available data. But we all know a story about best intentions and hell.
Diagnosis 4: Wrong approach or assumptions-based approach
Let us see the path that one lubrication work order goes through. Someone in charge generates a work order and gives it to the lube tech to execute. Later that afternoon, he comes back with the same work order, with all the boxes ticked with a green checkmark. Seriously? A green checkmark? That’s all there is to support the responsibility of his task? A checked box only proves one thing…that my lube tech owns a green pencil. It certainly does not prove that he did anything to improve the condition of that bearing. The elephant in the room that nobody wants to talk about is a simple question, “Is the bearing better now?”
Diagnosis 5: Lack of data
Why don’t we take a walk and take a look? If you really want to see it, you will see lots of horrors, and it has nothing to do with technology. It has everything to do with culture. This is probably the most difficult challenge organizations face. While technology answers, “what is done and how”, culture is built on making clear, “why is it done and why is it done that way?” Culture is rarely achieved by rules and procedures. Culture, by definition, consists of four elements: values, beliefs, behavior, and rituals.
Procedures are rituals, they occur as a result of the first three elements. Surely culture is built from the top down, but it can be destroyed in both directions. Culture comes from understanding WHY. Does everyone understand why?
Diagnosis 6: Lack of culture
Many years back, the industry experienced a long, and in some cases, painful transformation when condition monitoring and the whole concept of condition-based actions evolved from planned and easy to evidence-based. Sure, there was a lot of resistance, and still, we can find resistance in some areas, in some industries, and at a certain age. By some miracle that I simply don’t understand, lubrication was left out of this transformation. From today’s point of view, it is simply unbelievable. Let’s look at it this way: lubrication certainly falls in the group of “do” activities, while condition monitoring falls (in most of the cases) in the “observe/conclude/recommend” group. The mindset of CM people is, essentially, not to accept time-based as a rule, but to believe in condition-based as determined by measurement. Condition-based on evidence. All CM people will unanimously say that lubrication is critically important. Still, most CM people gave their silent blessing to the very same critically important job being done based on time. At the same time, they do not believe in it. Quite a paradox, isn’t it? Looking at this entire process from the present time, I would improve both the “do” and the “observe” part in one unique process. The entire LUBExpert Solution transforms lubrication practices to fit in the same work frame and mindset that we all know from condition monitoring, evidence-based. You will see, at least those of you who will implement this solution, how natural and aligned to the common sense of all stakeholders it is.
In essence, it is driven by the very same questions you should ask yourself every single time you take something as lethal as a grease gun in your hands:
- Does it need grease?
- How much?
- Is it better now?
Each of those questions represents a Mount Everest of complexity, but there are brains within both LUBExpert and UAS to help you navigate to the peak. Still, it is essential to understand the importance of those three questions and use them as a driver. Once the lube team members start working with the same mindset as CM, collecting extremely valuable data, they become the first line of defense in the full meaning of that word. That is now a reality. Until now, it was normal practice for the CM team to sometimes recommend lubrication. It is not a secret that when a vibe tech is not completely sure of the problem, he simply tells his lube tech to add some grease. Maybe it is a lubrication issue. Grease administered as a painkiller does not bring much benefit. It may, at best, temporarily treat some symptoms. Combining time-based lubrication with occasional requests coming from CM tech actually causes a lot of damage. The good news is that there at least exists a communication connection between CM and Lube, now let’s just make it the correct one.
Diagnosis 7: Evidence-based mindset
A long list of serious possible diagnoses. Luckily those are not in Latin, so even we, non-medical people, can do something about it. With a clear view of the big picture and now the right mindset, it is time to do it.
Watch our 5-Step Acoustic Lubrication Procedure motion graphic for an effective way to grease your bearings right and brings you one step closer to best practices for your lubrication program.
Thank you Haris Trobradović with SDT Ultrasound Solutions for sharing this informative article with us!
by Diana Pereda

I was taught by people much more clever than me not to pay attention to features, but look out for benefits. Not only me but the entire team I belong to has the same mindset. A real journey that everyone in the industry should take when considering changes or improvements through technology & culture is defining benefits and evaluating them. The final step of that journey, and probably most painful, is justifying bright, shiny, and attractive features against benefits. No one likes to do that, we are all just like kids, fascinated by “look what it can do”. It’s human to be this way… some might even call it “normal”.
We can easily identify two possible outcomes of being fascinated by features:
- Having and using for a brief period, something that brings no real benefit
In this case, there are no benefits at all. It is very similar to impulse shopping. It works for many manufacturers driven by pure sales results instead of delivered benefits. But again, it’s just human, that is how the world works for those who seek sudden, short-term adrenaline boost. Luckily, I have no experience with this from any perspective (neither as a solution provider nor a consumer)
- Being blinded by some excellent features so much that journey towards real, long term benefits actually stops right there
This one is really interesting. It happens when a “patient” (any industrial organization) suffers from a certain acute problem that is usually trivial and should have been resolved long ago (normally, those trivial problems are causing huge financial losses). Looking at the whole through the prism of acute problems causes shortsightedness. It also causes a sudden adrenaline rush because the acute problem is resolved in a matter of hours with a very small investment of time and money. The difference between this situation and the first case is that there are benefits; discovered and evaluated. Low fruit is there, so let’s just stand over there and look happy.
That is the problem!
Being momentarily happy and self-satisfied stops the journey. Many people experienced this during their Root cause analysis process. Stop at a certain point because the result looks nice.
Discovered benefits at this point are only the tip of the iceberg. Obviously, it depends on where you stand and look at it. Standing too close gives a very small angle and only acute problems are visible. As a result, it works as a band-aid on cancer, not very well at all. Stepping away gives a much wider angle where all systemic shortcomings (potential benefits) are clear. This is often recognized through reactions and comments like;
“This feature really resolves my problem”, “this way we perform better” and “this affects everything and everyone”.
You can clearly recognize the decision-making level of each person giving those comments. From the execution level, through the departmental level, to high management level. All three levels are, beyond any doubt, equally important. Still, depending on which comment is the actual driver of decision and implementation, you will have a tool, routine, or strategy.
Short distance – small-angle – acute issues marked and resolved – tool – pain killer
Medium distance – wider angle – departmental approach resolved – routine – makes us look good
Long-distance – big picture – organizational impact – strategy – full and sustainable benefits
Download our 5-Step Acoustic Lubrication Procedure for an effective lubrication procedure to grease bearings right.
Thank you Haris Trobradović with SDT Ultrasound Solutions for sharing this informative article with us!
by Diana Pereda
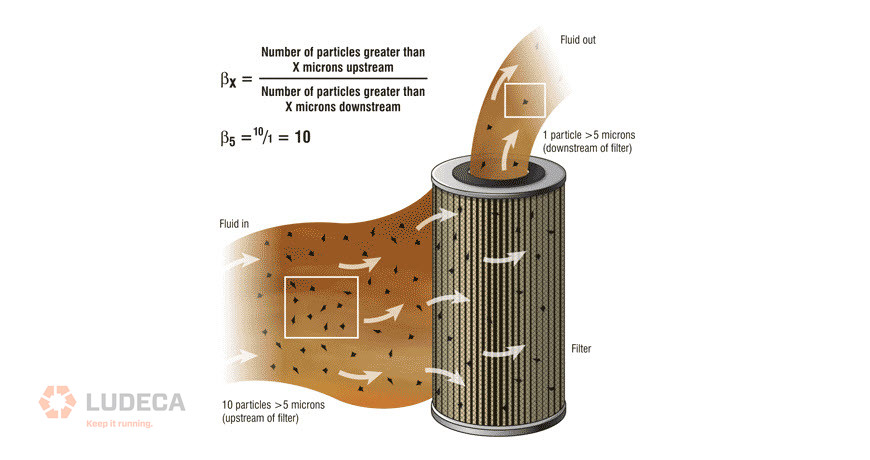
Oil Filter Performance Ratings
You may have heard someone say, “a filter is a filter.” Although catchy, this phrase is very misleading. It is said assuming any filter will get the job done. Not all filters and lubricants are created equally. There is no one size fits all in this world of lubrication. Lubricants and filters must be selected based on the application. So why do we view oil as a consumable instead of an asset? Why do we see changing oil filters as a task that we complete off a schedule or perform filtration only when the oil lab says the oil is dirty? An oil filter to our oil is like a liver to our blood. With that understanding, we can appreciate the importance of proper filter selection and the decision to use a filter cart vs a permanently mounted filtration system. The first thing that may come to mind when choosing a filter is the micron size. Here comes the fine print. You may see a few specs on most filters such as nominal rating, absolute rating, and beta ratio. If you do not see either, keep shopping. Absolute rating is generally defined as the smallest pore size in a filter’s media or the largest particle size that can pass through the media. A nominal rating is an arbitrary number used to define a filter’s ability to remove particles of a given size as a percentage of weight. Although both Nominal and Absolute define a particle micron rating, none are specified using a universally accepted testing method to validate the performance of the filter. Pulling your hair out yet? Do not worry, take consolation in the Beta Ratio. The Beta Ratio is a value determined through the Multi-pass Method in ISO 16889:1999. During this test, particles of a known size and quantity are added upstream of the filter and are measured with particle counters both upstream and downstream. The upstream count is divided by the downstream count and the result is defined as the beta ratio. Essentially the beta ratio can be understood as the filter’s efficiency to remove a specific particle size. Beta ratios are defined as 2, 10, 20, 75, 200, 1000, and 2000. A 3-micron filter with a beta ratio of 2 means that the filter is 50% efficient at removing particles 3 microns and larger. A 3-micron filter with a beta ratio of 2000 means the filter is 99.95% efficient at removing particles 3 microns and larger.
Oil Filter Performance and Selection
Ok, now that we have discussed the details of filter performance ratings, let’s discuss the other important factors when choosing a filter. Initially, after learning a little bit about filtration, you may ask the supplier to give you the smallest micron rating with the highest beta ratio available simply because it will clean the oil better. Whoa, there is more to consider. Things such as the machine and bearing type will help determine the target oil cleanliness level. After all, we need to make a reasonable cost/benefit decision here. What about the oil properties? Can I go too small and filter out additives? The short answer is yes. Additives such as viscosity improvers and antifoam agents can be filtered out, especially at the 3-micron range. It is wise to consult with your oil manufacturer to help determine the ideal filter size and oil temperature range for filtration. What about the application? This is important to consider to know how clean of an ISO target you need to meet. Are you looking to upgrade the existing filter on the factory oil circulation system? If so, you need to be aware of certain properties of the filter housing and media such as burst psi, operating psi, psi drop across the media and housing, differential psi, and oil compatibility. It is safe to assume that a smaller micron filter with a high beta ratio will lead to a higher psi drop across the filter because it will require more psi to flow through the media. Other variables that increase psi drop are viscosity and flow rate. Why the obsession with psi and psi drop? For pressure, it boils down to the psi rating for the housing and the pump. Let’s say that the existing pump ran at 80 psi with the current very porous and ineffective filter, and the pump has a bypass psi of 100. If you decide to install a 7 micron Beta 1000 filter you may create enough restriction inflow that the pump will hit 100 psi and go into bypass. In this case, the pump is not pumping oil through the filter, but bypassing it internally or externally, thus providing no filtration, no flow, and creating heat. What about psi drop and differential psi? Differential psi is the difference between upstream and downstream psi. It is important because it is an indicator of the filter service life and saturation or, “how dirty it is.” If you currently change your filter based on calendar days or operating hours you may not be aware of the importance of differential psi across a filter. As a filter gets saturated with contaminants the downstream psi decreases as the upstream psi increases. Eventually, if equipped with a bypass, the filter will go into bypass to prevent it from collapsing or rupturing releasing all the contaminants back into the system. Most inline filters are equipped with a differential psi gauge or a pop-up indicator that will let you know when it is time to change the filter. Some filters have a bypass at 15 psi and others at 65 psi. Therefore, readings in those ranges mean it’s time to change the filter. What if you install that new filter for the first time and instantly the differential psi is indicating a dirty filter? This scenario is very much a possibility if you overlooked details that play a role in psi drop such as viscosity and flow rate. For example, if you select a filter housing size to accommodate a gearbox recirculation system with a flow rate of 5 GPM that circulates an oil with a viscosity of 220 Centistokes, your filter will work just fine if the flow rate stays at 5GPM and the viscosity stays at 220 Centistokes. The problem in this scenario is that although the pump may provide a consistent flow rate of 5 GPM the oil viscosity varies with temperature. In this case, the gear oil increases in viscosity as the temperature drops, therefore increasing the psi drop across the filter. What can you do? You can increase the filter housing size or, although not ideal, you can mitigate the variable of oil temperature with an oil heating element.
Oil Filtration Systems
Now that we have talked about filter performance and selection, should you have a permanently mounted oil filtration system or filter with a filter cart periodically based on the oil analysis report? Well, folks, this is a loaded question. Ideally, a dedicated filtration system is the best choice as it ensures clean oil while in operation. The problem here may be the cost of running power to support the recirculation system. However, if the asset is very high in the criticality ranking it may be easy to justify. The case may be the opposite for an asset that has very low criticality, although best practice may be to have a dedicated filtration system, the benefit may not outweigh the cost. In this case, periodically using a filter cart may suffice. Other things to consider are factors such as safety and environmental impact. If the machine is 10 floors up in the air and you must haul a 65 lb. filter cart up those stairs, the safety impact of doing that task may merit the investment of installing a dedicated system or purchasing a filter cart to leave on that 10th floor. What if you are in the unfortunate position of not being able to do either? In this case, filter the oil to the specified ISO target before topping off the gearbox and mitigate the risk of contamination by installing high-quality breathers, sample ports, and level indicators. In summary, filtration and lubrication is a very technical responsibility, that should be treated with the utmost importance. Unfortunately, in some cases, the role of lubrication is viewed as a secondary task to maintenance or viewed as an entry-level responsibility. I hope that in reading this blog we can give lubricants the respect they deserve, after all, they are the lifeline of our machines! Please contact us to learn more about lubrication best practices and see what we can do to help you Keep It Running.
Watch our 5-Step Acoustic Lubrication Procedure Motion Graphic which outlines an effective way to grease your bearings right and bring you one step closer to best practices for your lubrication program.
Related Blog: Is New Oil Clean Oil?
by Diana Pereda
