When monitoring the vibration data of a machine, an analyst will want to look at the Time Waveform (TWF) and the Frequency Spectrum or FFT (Fast Fourier Transform) output, as shown below.
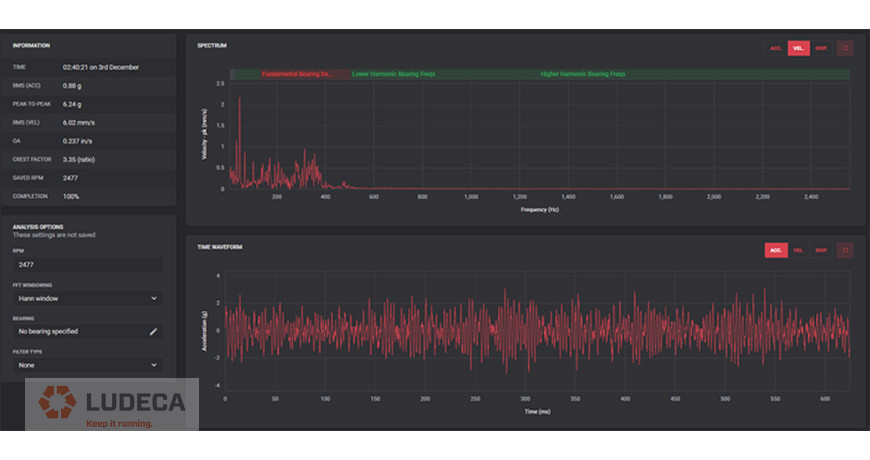
These two example plots are very useful for determining obvious failure modes, such as, an imbalance with a high amplitude value of Overall (OA) Velocity in the 1 X RPM band or a slippage between two components causing amplitude modulations or beat frequencies visible in the TWF.
For more complex analysis, analysts require further tools to diagnose better the issues. Playing the TWF as an audio file is a good way of listening to the vibration to potentially hear knocking, pinging or high frequency whistling, denoting a problem to further diagnose, as if you were actually beside the machine.
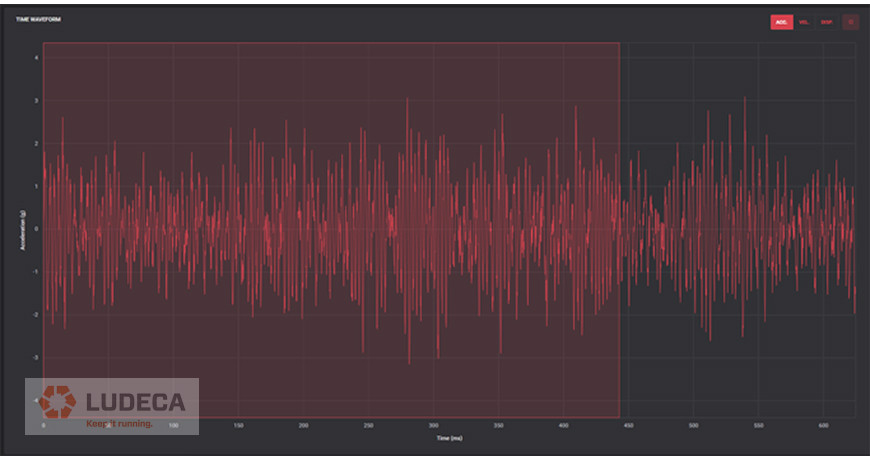
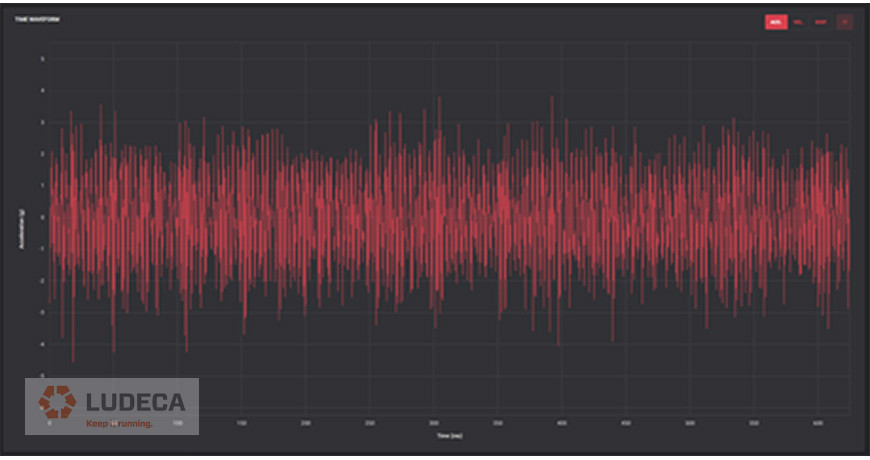
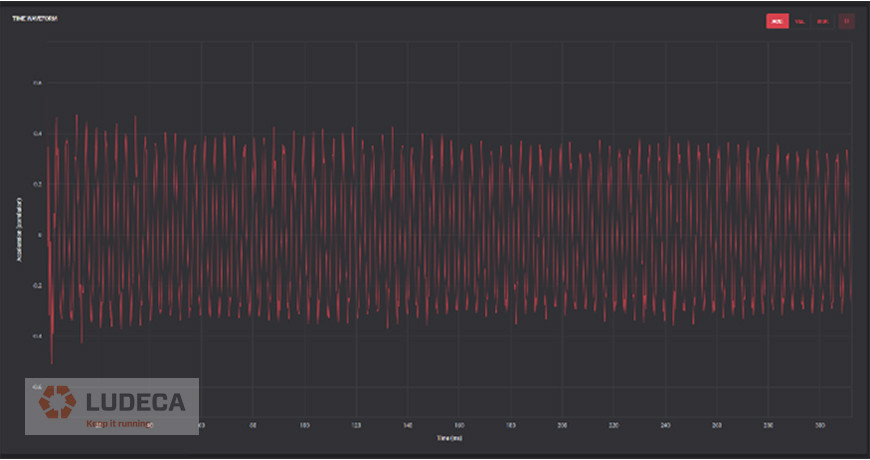
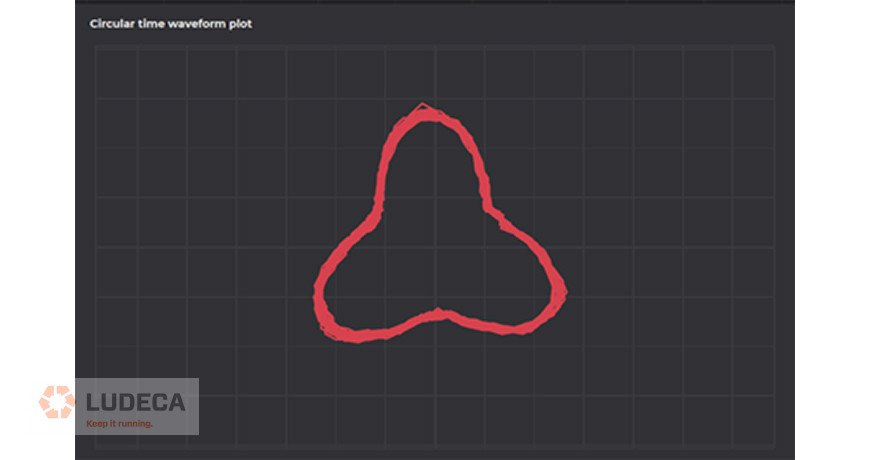
Auto-correlation and circular plots are two other useful techniques applicable to the TWF. Auto-correlation can be useful to remove noisy signals and determining the periodicity or repeating patterns in the vibration signal. The TWF below shows this before and after auto-correlation is applied.
Finally, an additional step to visualize this better is to perform a circular plot. In the example below the three peaks indicate this application is a pump with three vanes. In this plot view using it can easily determine such failures as a broken fan blade, an imbalance on a vane, or rotor bar issues (if on a motor).
So as a vibration analyst make sure you use all the tools available to you in your software platform for ease of your analysis.
Thank you Alan McCall with Sensoteq for sharing this informative article with us!
Filed under:
Vibration Analysis by Diana Pereda