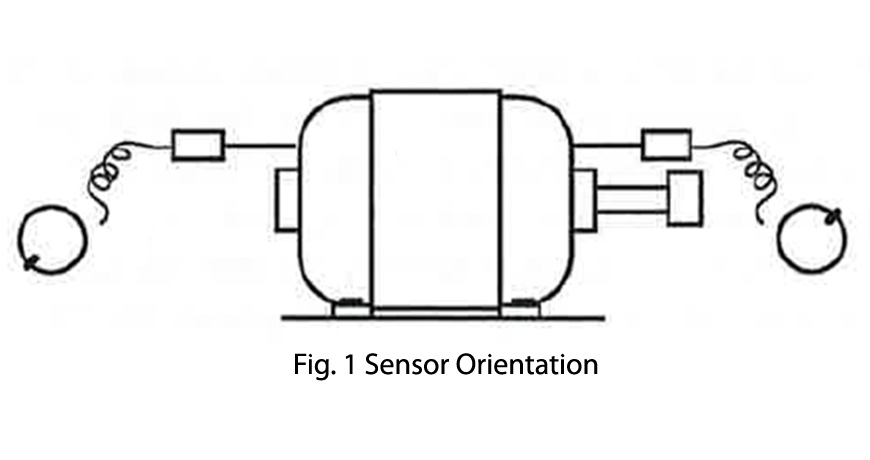
When using phase to determine how a machine is moving, the orientation of the sensor mounted on the machine is extremely important. In Figure 1 below one sensor is attached to the motor’s outboard (non-drive) end in one orientation, and on the other inboard (drive) end, it is mounted in the opposite direction.

Because the sensors are attached to the motor’s ends opposite one another the resulting phase angles would be 180 degrees opposed to each other. To correct for this, the user has to choose a reference location and then correct the measured phase angle for any sensor locations where the sensor position is opposite the reference.
For measured phase readings of less than 180 degrees the user would add 180 degrees to the measured phase angle and for measured phase angles that are greater than 180 degrees the user would subtract 180 degrees from the measured reading.
In most applications this occurs most often in the axial direction of measurement; however, sometimes due to obstructions, the user cannot physically place the sensor in the same orientation as the reference sensor in the horizontal or vertical axis.
Just as with the axial direction, the user will have to determine a reference location and then correct the measurements for any locations where the sensor position doesn’t match the reference location.
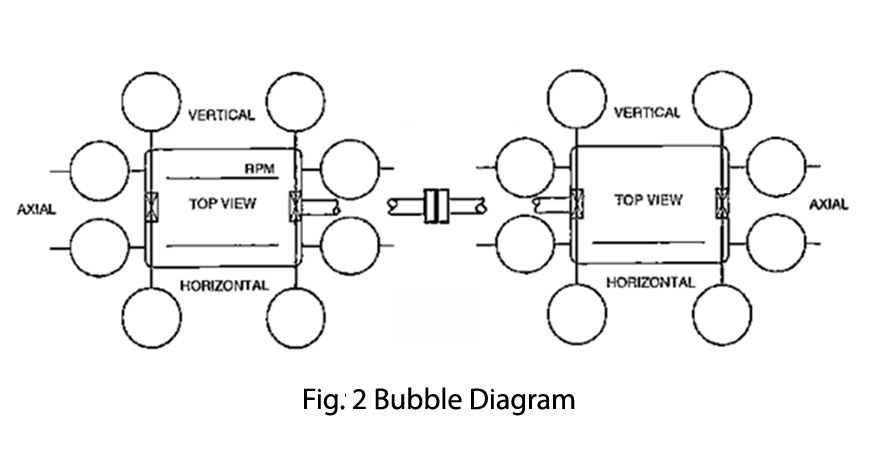
Figure 2 below is what is commonly called a “Bubble Diagram”. The bubble diagram is used to record the vibration amplitude and phase angle at all machine locations in the machine train in the vertical, horizontal and axial directions.
As previously stated, the analyst must determine if any sensor measurement locations will require the sensor to be attached to the machine differently and adjust the phase readings at locations different from the reference accordingly.

The easiest way to keep track of reference directions and location is to draw a little arrow as shown below in Figures 3 and 4. If the arrow is pointing towards the machine this indicates that the phase angle was recorded directly as indicated.

When the arrow is pointing away from the machine as shown above in Figure 4, the phase angle recorded in the bubble diagram is 180 degrees opposed from what was actually measured.
Source: Practical Solutions to Machinery and Maintenance Vibration Problems by Update International
Our advanced vibration analyzers, along with phase analysis, can help you better diagnose fault conditions.
Filed under:
Condition Monitoring, Vibration Analysis by Dave Leach CRL CMRT CMRP
