
A key feature of online machine condition monitoring systems is the automatic and immediate notification of system operators or service personnel. Technicians notified by email or SMS of increases in damage are able to react without delay. Today’s Internet is basically a global communications network at our finger-Technology tips. What, then, could be more obvious than taking advantage of the Internet for the communication requirements of condition monitoring systems. Just imagine: The monitoring system automatically sends you an eMail when condition deterioration sets in — along with all of the information you require for damage analysis. Thanks to the capability of today’s wireless communication networks, the service engineer responsible will be notified immediately, regardless of where in the world he may be at that moment. PRUEFTECHNIK online condition monitoring systems like the VIBROWEB® have already been equipped with these new functions and take advantage of the new web technology.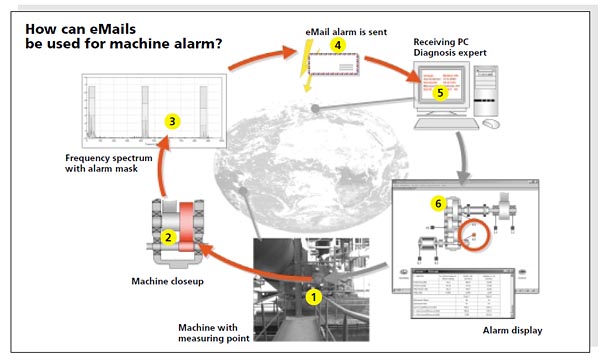 eMail – how does it work?
One of the most important Internet applications is eMail or Mail for short. The fact that Mail is not restricted to letters or texts, but can also be used to transmit files of any type is of particular significance. Unlike other Internet applications such as WWW, FTP, or Telnet, the Mail system does not require a direct connection between sender and receiver. Consequently, the receiver and sender computers do not have to be online at the same time. The Mail system is based on the concept of intermediate mail routers that receive and forward messages. Generally, the sender first directs the message to the Mail router of the Internet provider using suitable Mail software capable of the so-called SMTP protocol. SMTP stands for Simple Mail Transfer Protocol and defines the transmission of messages both by the message sender and between Mail routers. A message is passed from one Mail router to the next until it reaches the router responsible for the mailbox of the receiver. The first Mail router to accept the mail from the sender functions as the Mail gateway. The Mail router responsible for the receiver mailbox functions as the Mail Server. Once it has reached the Mail server mailbox, the message can be transported to the receiver’s target computer. For this to happen, the receiver must retrieve the Mail from the Mail server. This not only has the advantage that you can retrieve your Mail whenever you want, but you can also do so from any computer. Regardless of where you are, if you have Internet access and appropriate software you can access your mailbox at any time. The POP protocol is used for this purpose (Post Office Protocol). The user PC must have a suitable Mail program that registers with the Mail server by providing a user name and password and that queries whether there is any mail. The user PC is referred to as the Mail client. Any available Mails are listed and can be downloaded individually by the Mail client via POP.
SMS notification
Mail servers can provide services that supplement the automatic notification system by sending an SMS message to the receiver’s cell phone when an incoming Mail arrives.
eMails and condition monitoring
In condition monitoring practice, the vibration condition is evaluated using the overall vibration level or alarm masks for frequency-selective monitoring. If the PRUEFTECHNIK system detects that the limiting value has been exceeded, it can automatically send an eMail via the Internet or Intranet. The receiver obtains a clear text message containing the location, date, time, and cause of alarm. The information (time or frequency record) when the damage occurred is attached to the eMail. For additional analysis, the maintenance technician responsible logs into the Internet or Intranet and analyses the system at “local telephone rates” — without travel costs!
by Mickey Harp CRL
Thank you for attending our Webinar on Effective Defect Analysis: Maximizing your Vibration Setup by Mitch Stansloski, Ph.D., PE – Pioneer Engineering
If you missed our Webinar, you can view it on demand at any time.
We hope that you found your time with us to be informative and interesting. Here are the answers to your questions:
Q: Does the Nyquist sampling theorem come into play with your analysis?
A: The Nyquist Sampling Theorem states that there must be at least two samples per cycle in order to prevent aliasing. If less than two samples per cycle are collected, false low frequencies develop. In practice, the sampling frequency is set to 2.56 times the maximum frequency desired or higher for some devices. Some devices may sample at a higher rate to provide more detail on the data being acquired. This additional data can increase the accuracy of the measurements and calculations as a result.
Q: Does vibration help with hydraulic pump problems?
A: Yep! For the sliding vane type or gear type, the pumping frequency is the number of vanes or gear teeth multiplied by the running speed.
Q: For collecting data on shovels, that run 24/7, would you still follow the interval settings that you presented, or is there a different method to use?
A: Since these are so critical and have such massive loads, I would set the intervals closer than recommended until experience dictated otherwise.
Q: For resolution, the question is 2 Hz to 1.23 Hz acceptable for how the LUDECA signal processing works? In regards to an envelope-bearing defection, do you recommend the high pass to low pass filters to be no more of a difference of 2 to 4 kHz?
A: Not sure I understand the first part of this question. For envelope bearing detection, I would set one to find stage one bearing defects. This would put the filters at 5kHz to 40 or 50kHz. I would set another to find stage two bearing defects (bearing resonances). This would make the filters at 500 Hz to 5kHz.
Q: For resolution, in regards to delta F value to stay between 2 Hz to 1.23hz, this value is f max divided by # lines?
A: Resolution is the frequency range divided by the number of lines.
Q: Looking at a reduction gearcase, wouldn’t the slower output with fewer CPM’s need more averages in order to get a better sampling rate verse the high-speed input which is turning faster and would require fewer averages?
A: The number of averages won’t affect the sampling rate. In general, we recommend more averages for higher frequency ranges. But, you may still want a few more averages for the output of a gearbox since there are many transients that are low frequency. A faster turning shaft wouldn’t require fewer averages.
Q: How would you develop a collection interval with varying loads?
A: Choose the worst caseload, as a function of load and duty cycle.
Q: How did you calculate the belt frequency, please?
A: Belt Freq = Input Speed x pi x Sheave Diameter / Belt Length
Q: How do I determine the monitoring cycle based on load?
A: The bearing L10 life equation does show that the life is inversely proportional to the load cubed. So, as load exceeds recommend, collection intervals should dramatically shorten.
Q: How do you ensure adequate resolution on a time waveform?
A: Inadequate resolution on a time waveform will cause erroneous low amplitudes. Keep improving the resolution until the amplitudes are maximum and repeatable.
Q: How do you find the load on a particular machine…Is there a formula?
A: Converting the current draw to horsepower is likely the easiest way.
Q: How do you set up the proper resolution? What parameters do you use to decide what resolution to use?
A: If using a Hanning window, the resolution should be set so that it is 1/3 of the smallest peak separation needed to correctly distinguish between defect frequencies.
Q: How many averages do you recommend for vibration data collection?
A: A rule of thumb is to start at 4 averages with a frequency range of 120,000 CPM and then go up or down from there.
Q: What is a good Fmin setting?
A: If collecting a velocity spectrum using an accelerometer for collection, the Fmin should eliminate the integration error found in the first frequency bin. So, the Fmin should filter at least the first bin.
Q: What’s the best way to deal with variable speed?
A: Orders based will work if the speeds are variable but don’t change constantly. In addition, multi-level alarms based on running speed could be used. For machines whose speed varies constantly, order tracking is required in order to obtain a clear spectrum.
Q: Will it not be messy to have a number of frequency range for different types of equipment is the same route of measurement?
A: The data collector doesn’t care how you’ve set up your collection specification. And, neither does your trending software, Better to have a more detailed database and valuable data than one that is simple but ineffective.
by Mitch Stansloski PhD PE
Reliable Plant, August 2010
Ah, to be able to predict the winning numbers in a lottery – who hasn’t had that dream! Life would be so easy and carefree with a crystal ball. And, would not your maintenance job be so much simpler if you could just identify machine damage in time and predict the point at which repairs really become necessary? According to DIN 31051, condition-oriented maintenance is not limited to inspection, servicing, determination of the machine condition, and maintenance schedule. It also encompasses predicting the length of service life remaining for machines and systems. This means it is not always necessary to replace a rolling bearing when an inspection measurement reveals inner raceway frequencies. This article describes how it was possible to keep a damaged bearing running for several months until the scheduled annual outage came around – naturally under close observation. Periodic measurements had shown that there had only been a slight change in the envelope spectrum. But one thing at a time …
Read the entire article Vibration analysis is like winning the lottery
by Mickey Harp CRL
Pumps & Systems, August 2010
Frequency analysis is an important method of vibration analysis. It provides information on vibration sources and helps identify those components in the vibration signal that are often small, but nevertheless important, for diagnosis. Each vibration can be attributed to a particular excitation source or machine part.
Read the entire article: Basic Rules for Measuring Frequency Spectra
by Mickey Harp CRL
The following situation occurred at a Municipal Power Plant. During a planned outage, the on-site team was utilizing a Rotalign® Pro with Boralign® to assess the position of the bearing bores after the removal of the rotor on an Allis Chalmers power generation steam turbine. The results were varying far more than normal and the customer wanted to understand why. I was called in to make sure there were no errors in the use of the Boralign system. The tool was being used properly and there were no problems with the tooling. The customer had already set the unit up on a surface plate and established that there was no appreciable drift with the tool. I suspected excessive vibration, so I used my Vibscanner® to measure overall vibration in displacement. No significant level of vibration could be detected; certainly not enough energy to cause the level of non-repeatability they had been observing in the readings. I thought if the movement of the lower shells had a very low frequency that was too slow to measure utilizing traditional vibration sensors and methods, I might be able to measure it with the Rotalign Pro Straightness program. Both the laser and receiver were mounted on standard magnetic dial stands with brackets that are part of the Straightness hardware set. A series of points were established on the lower shells to measure between, both along the rotational axis and from side to side. Setting the Rotalign Pro Straightness program to the shortest sample time and observing the X-axis values over a 2 to 4-minute period, I was actually able to see a very slow movement between various points on the lower shells. While some areas of the lower shells were reasonably stable, there was movement between some points that was as much as .024”, but at a very low CPM. While this process was somewhat like ODS, there was no real-time phase data, so I could not tell how the various points were moving relative to each other. It was still very helpful to the rotating engineer to understand how much the various areas were moving. Better yet, with a fairly simple program and only 6 hours invested in collecting the data, the rotating engineer had a good idea of the magnitude of the problem.
by Keith Van Hentenryck
LUDECA, INC. introduces VIBXPERT® II, the latest addition to the PRUEFTECHNIK family of portable route-based vibration data collectors. VIBXPERT II is rugged and lightweight —weighing only 2-1/2 pounds! It combines the advantages of a rapid processor with a brilliant energy-efficient color VGA display. Enhanced with a Fmax of 51KHz and up to 102, 400 Lines of Resolution, all machinery problems can be captured and easily analyzed on the VIBXPERT II large color screen. The VIBXPERT II Basic platform is a 1-channel device that can be upgraded at any time to 2 individually configured channels via a special passcode —user-upgradable and does not require hardware changes. 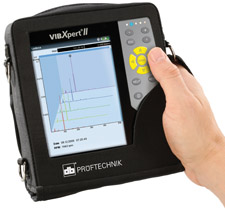 All forms of machine vibrations, bearing conditions, process data, and visual inspection information can be collected and stored on the expandable Compact Flash Card (up to 8 gigabytes) for report generation or for later transfer to the powerful OMNITREND® software for further analysis, reporting and archiving. The VIBXPERT vibration analyzer provides an easy-to-use icon-driven platform that offers comprehensive analysis functionality for the diagnosis of simple or very complex vibration problems. Capabilities include order spectrum, phase, cepstrum, cross-channel phase, orbits, run-up, and coast-down measurements, bump test, negative averaging, and more. Analysis tools, including various cursor types, machine-specific frequency markers, signal post-processing, and extensive bearing databases are included for evaluating each spectrum. Alarm notifications based on ISO standards or user-defined standards are visually identified with the aid of colored LEDs.The VIBXPERT II features modular functionality including dynamic field balancing, extended time waveform recording, transient data capture, UFF file export, Modal/ODS support, and more.
by Ana Maria Delgado, CRL
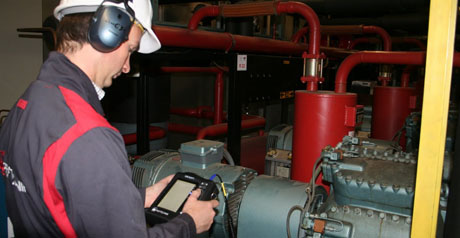
How fast is the data collection speed of your vibration data collector? You may feel that this is not an important characteristic. Does it really matter if a data collector is one or two seconds faster-acquiring data versus another? Data collection speed is very important and should be taken into consideration by your facility management and Condition Monitoring Group. For example, consider a vibration monitoring program that monitors 1000 machine trains per month with 10 measurement points per machine train. If a vibration data collector requires 8 seconds to acquire data for each measurement point, then it would necessitate 22 hours of real data collection time (this does not include time moving between each machine, reporting time or etc). Does a second really make a difference? A data collector that is one second faster acquiring the same data will result in 3 hours per month saved or almost one full man week per year. If the data collector is 3 seconds faster in acquiring the same data, then the time savings are more substantial. A savings of 3 seconds per measurement point will result in a savings of 2.5 man-weeks per year. Multiply the time savings by your labor cost per hour and the savings could be very important to your facility. The savings may surprise you!
Take a look at our new VIBXPERT II analyzer featuring a crisp color display, fast data acquisition, and powerful vibration diagnostics tools.
by Trent Phillips
Successfully persuading your management team about the importance of predictive maintenance requires a certain mindset, one that embraces the ideology that any failure in selling predictive maintenance lies within your selling techniques and not the management team. Success will simply depend on developing the proper selling methods. You are more likely to have success if you show management why they, not you, need predictive maintenance in the company. We have always heard that managers speak the language of dollars. This is true.
Attempt to avoid all technical reasons for justifying PDM and make good arguments based on savings and profitability. Reduced energy consumption, increased uptime, longer machine life, increased machine reliability, and improved products are just a few in a long list of items that will result from good PDM. However, just stating these items will not be very persuasive in your selling attempts. You must show how these benefits relate specifically to applications in your company and present dollar figures calculating the value added by the implementation of PDM technologies. Any data included with the dollar figures should be simple and easy to understand for a non-technical person. Trend plots, bar graphs, or pie charts are effective visual displays of such information. Your report should be concise but lengthy enough to convey relevant information. Brevity usually works best. If you don’t succeed on the first try, be persistent and improve your selling techniques. Remember, the fault lies in your methods and not with the management team. Luck is not a requirement for success. Only the proper arguments are required. Once the correct selling strategy is found, success is sure to follow.
by Bill Hillman CMRP
If you have been in the vibration industry for any length of time you have noticed many of the same catchphrases and acronyms have polluted what should be a simple science of vibration analysis. When setting up a vibration program there is one important word to remember. This word has been hidden over the last decade and not everyone has forgotten it, but some people have overlooked it, or have been distracted by all the bells and whistles of certain vibration tools. The word is TIME. With newer technology and advances in data collection speed, it is very easy to collect more data at quicker speeds. But is this a good thing? Refer back to the most important word: TIME. Now you can collect 10× the amount of data in the same time that it took four years ago. While that is good, someone still needs to look at all that data. Looking at a lot of data takes time. Reporting on a lot of data takes time. Time is money and the smarter use of time means saving or making more money. If you are a novice setting up a vibration program, or if you have had a successful vibration program for years, it is very important to maximize your time. Mean Time Between Failures (MTBF) is a common acronym that is tossed around a lot. The keyword, of course, is time. The definition of MTBF depends upon your definition of a system failure. A system failure may be defined as any component failure in a machine. However, a system failure could be defined as a component failure that prevents the machine from operating in the desired way. MTBF is the average elapsed time between such failures and should be calculated from a sufficiently large sample size of failures to be statistically meaningful. You can determine the MTBF for your equipment failures and use this as a tool to determine the monitoring frequency required for your vibration analysis program. You should make sure that you collect the vibration data on the specified equipment at a time interval that allows your vibration program sufficient time to identify the causes of equipment failures before the failures occur. If the MTBF, as an example, of a specific failure, is seven weeks and you collect data every 12 weeks, then your vibration program will most likely not be able to identify that failure. It is critical that you select the correct measurement period for the equipment faults you wish to identify. It is recommended that three measurement points be collected on each bearing or measurement location. It may be possible to collect data on fewer measurement points to save time. Once a problem has been detected, then additional data can be collected to verify the issue. Another technique is to use measurement bands in your data collection. The VibXpert series of data collectors allows this technique to be used. This method lets you customize the data acquisition around the specific failure modes (bearing, gears, imbalance, alignment, etc) of the equipment being monitored. This reduces the amount of data collection required, makes the data acquisition faster, and provides more analysis capabilities. All of this will save you time. Correct alarm settings can save analysis and reporting time. Correct setup of alarm levels for measurement bands can allow problems to be identified more quickly and accurately. This can save you time as well. It is important that you spend the required time to identify the correct measurement bands and alarm levels for each machine. Failure to do so may create the opposite result and increase the time required to acquire, analyze data and report the findings. This knowledge will allow you to find the correct measurement period to identify the necessary equipment faults. Some of the things that are discussed in this post will hopefully generate feedback. Please post your comments and let us know what you think.
by Mickey Harp CRL
April 2010 · Reliable Plant Magazine
It is common knowledge that technologies such as vibration analysis, shaft alignment, oil analysis, thermal imaging, motor circuit testing, and several other technologies are excellent tools to help achieve these results. These technologies can be used for the identification and elimination of machinery defects on a daily basis. Many facilities are content with the knowledge that machinery defects (bearing defects, gearbox defects, etc.) have been identified, scheduled for maintenance, and ultimately repaired utilizing these technologies. An optimized reliability program will constantly seek the root causes that create the machinery defects, thereby avoiding many chronic and recurring problems. Most facilities believe that finding the root cause of equipment defects can be difficult. This may be true in some cases, but it is not always the reality. In fact, many of the actual root causes of equipment defects can be easily identified. The elimination of these root causes will reduce the amount of equipment defects that must be repaired over time, help you achieve the goal of reduced maintenance cost, and increase profits at your company.
Read the entire article Do you want to increase profits and reduce maintenance costs for your facility?
by Trent Phillips
Fault frequencies are very important in vibration analysis because they allow the analyst to correlate vibration data to specific components in the equipment that may be in some stage of failure (equipment faults). Fault frequencies change with any adjustment in the speed of the equipment being monitored. Most modern vibration data collectors and vibration software will automatically re-calculate the displayed fault frequency information as the rotational speed of the equipment changes. Component information (bearing information, gear information, etc.) is required to calculate and display the fault frequencies of specific components in machinery. It is important to create fault frequency setups at the beginning of a vibration analysis program. Not doing so will affect the overall success of the vibration analysis program.
by Ana Maria Delgado, CRL
October 2009 · IMPO Magazine
Unlike imbalance, misalignment does not produce forces that are similar in the radius of the machine. Vibration in one radial direction may be very different in amplitude when compared to vibration in another radial direction. This is one instance where amplitude readings are not only helpful in detecting a problem but also helpful in diagnosing a problem. Misalignment can result in a machine having high vertical vibration on one end and high horizontal vibration on the other with other radial readings remaining low. Imbalance is not likely to cause this amplitude pattern.
Read Vibration Due To Shaft Misalignment
by Ana Maria Delgado, CRL