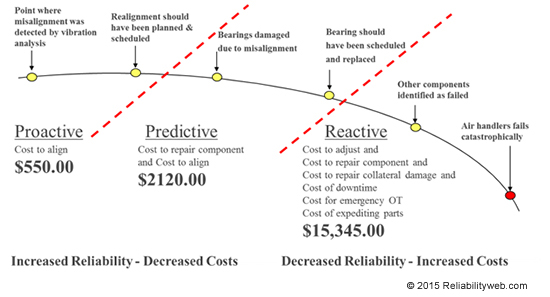
The Potential to Failure Curve (or P-F Curve) gives the user information on how an asset behaves before a failure occurs. This example is focused on failure due to misalignment. The goal of a reliability-focused plant is to be as far to the left on the curve as possible. While some companies are doing predictive maintenance work in an effort to reach the left side, many companies today are on the right domain of the curve, doing reactive work. Being in the reactive domain—putting out fires as they say— increases maintenance costs. This forces a company to perform unplanned work causes unscheduled downtime, and higher costs to expedite parts. Using technologies like ultrasound, thermography, and vibration analysis will catch an asset in a pre-failing state. This allows time to plan and schedule the repair to take place. However, with the right processes in place, the technician should recognize the misalignment of the machine before it causes components to fail. The ultimate goal is to be so far left on the curve, that it is off the chart, at the point where all the efforts (flat and rigid bases, accounting for thermal growth, eliminating soft foot, precision alignment, etc) are made so that the machine never runs misaligned.
Filed under:
Alignment, PDM, Reliability by Adam Stredel CRL