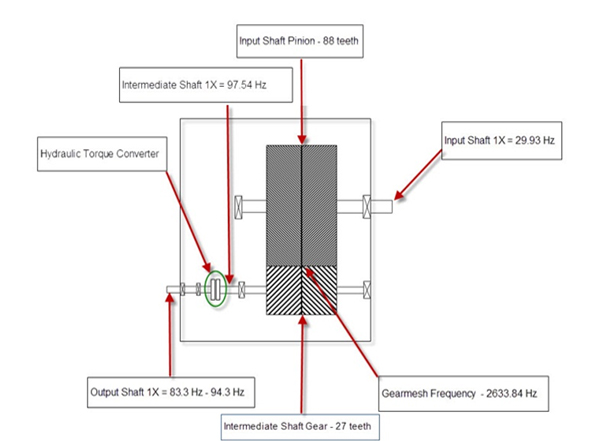
Recently, while assisting a customer in setting up a vibration database, the subject of creating the best trending template for a boiler feed water gearbox came up. This particular application requires trending templates to monitor a complex machine train consisting of four separate machines. For the purpose of this discussion, we’ll concentrate only on the gearbox in the machine train. The gearbox is a speed increaser. It is a little unusual in that a hydraulic torque converter allows the speed of the main boiler feedwater pump to be varied. This gearbox is designed with three individual shafts (an input shaft, intermediate shaft and output shaft), all enclosed within a single gearbox housing.
The speed of the input shaft is constant at 29.93 Hz (1796 rpm) and attached to this input shaft is a pinion gear with 88 teeth. The pinion gear runs in mesh with another gear mounted on the intermediate shaft with 27 teeth. This results in a gear mesh frequency of 2,633.84 Hz. We must determine the required frequency range (Fmax) by multiplying our calculated gear mesh frequency by 3.25 resulting in a Fmax of 8559.98 Hz. In the software, we can’t select 8559 Hz so we’ll need to select the next higher value, 10kHz.
The next step in the process is to determine the speed of the intermediate shaft by using the following formula:
Intermediate shaft speed = 29.93 Hz × 88 teeth = 2,633.84 Hz / 27 teeth = 97.54 Hz or 5,852.4 rpm.
We must now determine the required lines of resolution (LOR) since we have two fairly closely spaced running speeds. We have the intermediate shaft speed, running at a constant speed of 97.54 Hz and the output shaft speed which is variable.
When the boiler feedwater pump is operated at 100% the output shaft running speed of the gearbox is 94.33 Hz or 5660 rpm. There are only 3.21 Hz or 192.6 CPM between the two shaft speeds within the gearbox. Therefore, our lines of resolution setting will need to be high enough to provide separation while performing analysis. With a Fmax setting of 10kHz, we will need a minimum of 3200 lines of resolution to distinguish between the two shaft speeds. 10kHz Fmax / 3200 LOR = 3.125 Hz bin width, but to be on the safe side I would recommend selecting the next higher resolution setting (6400 LOR). This will provide a 1.56 Hz (96.3 CPM) resolution to easily see the two different shaft running speeds for accurate analysis.
Below is an example of improper resolution for accurate analysis:
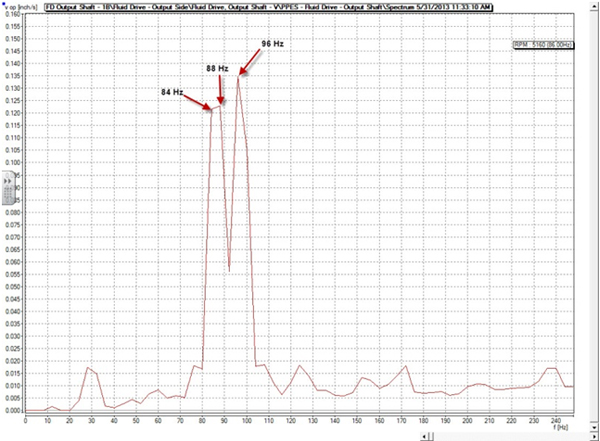
Improper resolution settings resulting in a flat top 1× for the output shaft speed. Proper resolution settings: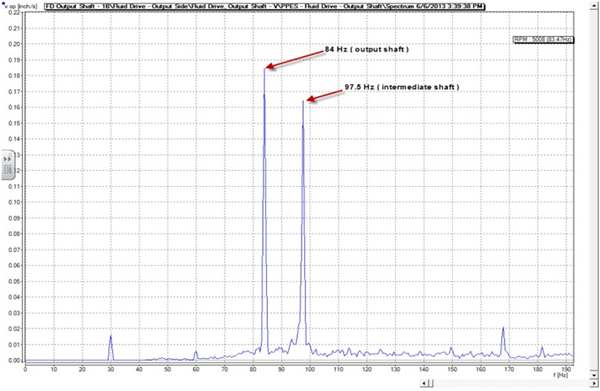
Correct resolution settings allowing clear distinction of the output shaft speed.
The lesson here is that proper vibration analysis requires understanding the machine design. Additionally, it is critical that the proper maximum frequency (Fmax) and lines of resolution (LOR) be determined. Improper Fmax settings will result in data being missed. Inadequate lines of resolution (LOR) can cause closely spaced peaks to merge together making it impossible to distinguish between them. These errors will result in poor vibration analysis results. Pay close attention to the details when setting up the equipment in your vibration database.
Filed under:
Condition Monitoring, Vibration Analysis by Dave Leach CRL CMRT CMRP