Have you desired to improve your analysis skills? Maybe you’d like to become more proficient with recognizing and interpreting the nuances of phase data? The best way to do this is by adding it to your daily routine, in your routes. By viewing phase data every day, you’ll soon become comfortable with it and it won’t be some of the “other stuff” you’re not used to looking at.
Simply add a cross-channel phase measurement to each point on a machine. Maybe just try it on one machine that has been a bad actor in the past. At first, you may want to “practice” analyzing with phase. Get out the old training material that has been gathering dust since you passed (hopefully) your analyst-level certification. See what it says about phase and its interpretation. LUDECA has some free help in the form of articles and technotes.
If necessary, further training is available with online sessions now added to the standard classroom offerings by many training concerns.
To get started with taking the cross-channel phase (CCP) with your routine route data, remember to take along an additional cable and accelerometer. The first time, you will need a marker to mark the place to put your reference accelerometer. When you get to the machine, mark the spot on the machine where you want to place your reference accelerometer. It will need to be meticulously placed in the same spot each time you collect data. Even though technically channel ‘A’ is the reference, I suggest you use channel ‘B’ as your reference when taking CCP in a route. In this way, you can move the ‘A’ accelerometer from point to point, just as you would when normally while collecting your route data, and the CCP will be a simple addition to your point data.
This will reverse the “direction” of your phase, so what would have been 270°, will now be 90°. Since both 270° and 90° have a “delta phase” of 90° from zero, the delta remains the same.
Place your channel ‘B’ accelerometer on the spot you marked, and begin taking data normally. When it’s time to take the CCP data, you will be prompted to tell the VIBXPERT® what the speed of the machine is. The speed you enter must be quite accurate as this can affect the quality of your CCP data.
When you collect the data, pay attention to the “Coherence” number at the bottom left of your VIBXPERT screen.
This number quantifies the reliability of the relationship between the vibrations sensed by your two accelerometers. It should be at, or very near 1. A ‘1’ signifies a very valid relationship between the vibrations sensed by the two accelerometers. The further away from 1, the less reliable your data will be.
Now, when you analyze the data, you will notice that each CCP capture has two distinct components, a “delta phase” and channel A & B amplitudes. The amplitudes are of course the amplitude sensed on each accelerometer at the chosen frequency. The delta phase is the phase difference between the two accelerometers at the chosen frequency.
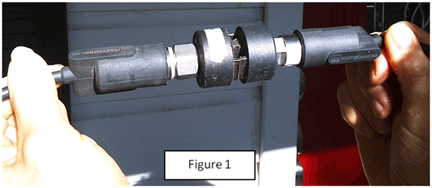
NOTE: It is very important, when analyzing phase data, to remember to allow for accelerometer orientation! The two accelerometers pictured in Figure 1 are “oriented” in opposite directions. They will sense exactly the same vibrations but with a 180° phase difference. To account for this orientation difference, one must either add or subtract 180 from the phase quantity.

As you compare the delta phase from point to point, remember to take into account the accelerometer orientation (see NOTE!)
Now you have “how”, or “in what direction at what time” the machine is vibrating. Couple this with your “how much the machine is vibrating” data that you were getting before, and certain defects (like misalignment) should be able to be diagnosed with a much greater confidence level.
Remember too that if there is no amplitude, there is no problem. For example, ‘In-phase’ vibration at horizontal radial at both ends of a machine coupled with in-phase vibration at vertical radial at both ends of the same machine, with the delta phase from vertical to horizontal of about 90°, is a very, very strong indication of static unbalance. But if the amplitude is well below the point at which any harm is done… no problem.
Enjoy analyzing with one more powerful tool in your toolbox in 2012!
Filed under:
Vibration Analysis by Mike Fitch CRL
