
When purchasing vibration analysis equipment, consider the following seven factors to ensure you select the most suitable and effective solution for your specific needs:
- Expandability: Choose a vibration instrument that can be upgraded with additional features and measurement capabilities as your needs grow. This ensures that your investment remains valuable and relevant over time.
- Reporting Capabilities: Look for a vibration analyzer that can generate comprehensive reports containing diagnostic results, complete with photos and notes. Detailed reporting is essential for clear communication and thorough documentation of findings.
- Advanced Diagnostics: Opt for vibration analysis systems such as the VIBWORKS LT that incorporates the latest Artificial Intelligence (AI) diagnostics technology. These advanced systems can assist in identifying machine faults more efficiently, reducing downtime and maintenance costs.
- Training and Support: Ensure the availability of training, mentoring and support from the vendor. Adequate training ensures that users can fully utilize the system’s capabilities, while reliable technical support is crucial for addressing any issues that may arise in the field.
- Accuracy and Precision: Ensure the vibration analyzer provides high measurement accuracy and precision. Reliable and repeatable results are critical for effective monitoring and analysis of machinery.
- Ease of Use: Choose a vibration analysis tool that is user-friendly and easy to operate. Intuitive interfaces, built-in help features, and straightforward operation can significantly enhance user experience and efficiency, and reduce the training burden.
- Durability and Build Quality: Assess the durability and build quality of the vibration monitoring system. It should be designed to withstand the harsh conditions of industrial environments, ensuring longevity and consistent performance. A cost-efficient upgrade path is a plus.
By carefully considering these factors, you can make an informed decision when selecting a vibration data collector that meets your specific requirements. This approach will help you find a solution that not only addresses your current needs but also adapts to future demands.
by Diana Pereda
The days of measuring vibration data directly at the machine once every couple of months are starting to disappear. There is still huge value in undertaking this activity, but it’s quickly being replaced by a wide range of IIoT sensors (Industrial Internet of Things).
Seemingly, one advantage is gathering data at a vastly improved rate. Rather than a single reading every quarter, data can now be captured multiple times every hour. The advantages are obvious: much greater visibility on developing faults and a trail to follow to track existing known issues.
But there are also some disadvantages. IIoT devices are battery-powered, so there is a balance to be achieved in data quantity, quality, and battery life. Typically, the faster you acquire data, the lower the battery life. If not, then the quality of the data might suffer.
It’s All a Balancing Act
In the case of condition monitoring, this might be reducing the FMax, lowering the resolution or only sending the spectrum rather than the full-time waveform. This can sometimes be against the desires of Vibration Analysts, who want the cleanest, highest resolution appropriate for the application.
Another problem that exists with such large data sets; how do you quickly sift through all these data sets to find what you need to look at? Is too much data inhibiting you from viewing the pertinent data you need to analyze?
Get the Data You Deserve
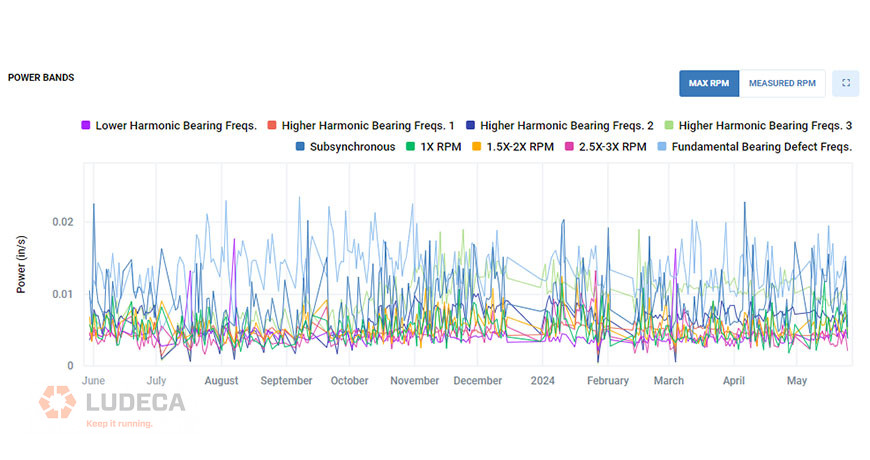
If using these IIoT systems, make sure that you select one that provides a good interface to search through data sets. Data views that trend key features in the vibration information so that you can quickly detect anomalies and go straight to the corresponding data set. Focus on systems that provide a good frequent snapshot to understand a fast change in trends, but still measures high quality waveforms and spectrums suitable for analysis.
Accuracy is Still Key
One other factor to assess is the accuracy of the data you are analyzing. Ask yourself these questions; How accurate is the frequency? Is the FMax suitable for your application? Is the amplitude showing the true energy? Is the data fully processed and ready for me analyze?
There are many tools that aid in understanding your machine’s health. Choose one that works best for your needs, but never underestimate how important data quality is to achieving an accurate assessment.
Thank you Sensoteq for sharing this educational article with us!
by Diana Pereda
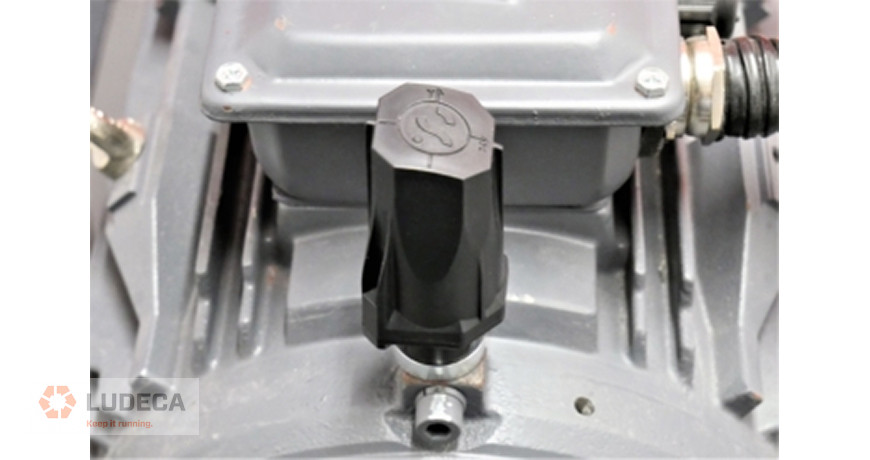
MYTH: “It is acceptable to use a stinger attached to the vibration sensor.”
TRUTH: Stingers can be attached and used with most vibration sensors. However, stingers are the least desirable method to mount the sensor to the equipment. Stingers reduce the frequency range that can be measured with the attached sensor. Also, it is very difficult to use the same amount of pressure to hold the sensor to the equipment each time. This may further reduce the signal response as well as the consistency and quality of data.
MYTH: “Applying generic overall amplitude values allows the correct trending and identification of equipment faults.”
TRUTH: An overall level is a single number representing the amplitude of a vibration measurement. Overall values can be derived in many different ways. You should be very cautious when assigning generic and/or the same alarm values to your equipment. Similar machines can operate at different vibration levels. The individual characteristics of each machine should be taken into consideration when setting valid alarm levels.
MYTH: “Collecting vibration data quarterly, semiannually, or annually on equipment will identify all equipment defects.”
TRUTH: The collection frequency of vibration data should be determined based on several factors. Some of these factors are equipment load, the operational speed of the equipment, operational frequency, criticality, and more. It is possible to calculate the optimal measurement frequency required to routinely identify equipment defects. Assigning some collection frequency based upon manpower or other means almost always results in equipment failures that were not detected in time or at all by the vibration program.
by Trent Phillips
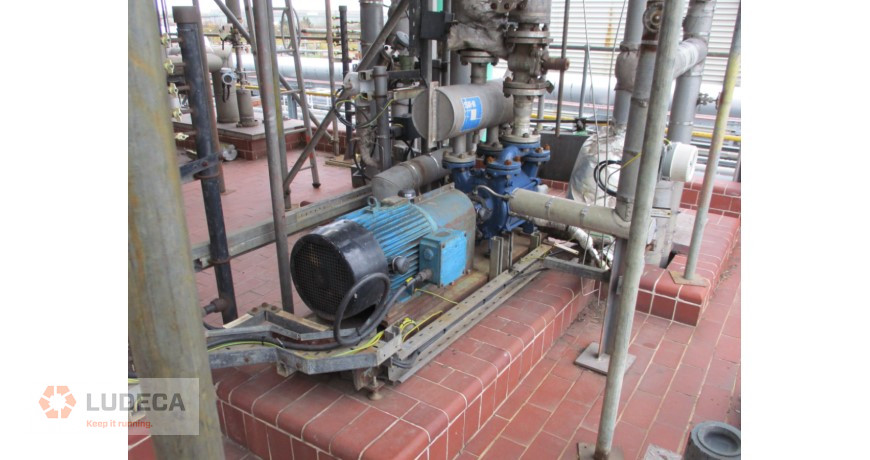
Sensoteq Kappa X wireless sensors have been deployed at a petrochemical plant in the UK to monitor machine vibration and prevent facility downtime. By using the sensor system for continuous machine monitoring, concerning defects with a vacuum pump were detected. Vibration analysts identified several issues on Analytix and calculated a fixed cost saving of $84,627.27 since installation.
Machinery and Operations

The petrochemical plant processes chemicals derived from petroleum for widespread use across many industries, including fuel and manufacturing. These petrochemicals are used for fibers, solvents and thousands of other products. The site uses several vacuum pumps to remove all air and vapor particles from an enclosed space. If a pump fails, the reduced suction can increase pressure, causing fuses to overheat and burn out, leading to machine damage and costly failures.
Implementation
To monitor vibration issues and potential bearing fatigue and faults, Kappa X sensors were installed on pumps and compressors throughout the site to measure potential bearing fatigues or faults. By detecting early signs of bearing wear, misalignment, and other faults, the Kappa X sensors enable predictive maintenance, helping to prevent unexpected breakdowns and extend the lifespan of the machinery.
Thank you Sensoteq for sharing this educational article with us. Click here to continue reading!
by Diana Pereda
Tired of being a vibration analyst? Sick of getting raises? Want to move to a different place of employment or collect unemployment benefits? Here’s one of the most sure-fire ways to accomplish it: Make sure nobody in management at your current employer understands how valuable your services are.
Seriously now, it is essential to your job security that management understands the value and cost savings that you bring to the organization.
- Make sure you quantify the “avoided cost” realized by your company due to your efforts or the efforts of those who may report directly to you. But never exaggerate the numbers so that no one will take them seriously. Be honest with your savings calculations. A job well done will save so much that exaggerating it is never necessary.
- Make careful reports that communicate to management the return on investment of your hiring, deployment, or training. Do not hesitate to report work and results that make your managers look good to their managers. This will ensure your longevity and prosperity quicker than you can imagine. Managers always like looking good to their bosses.
Be diligent and honest in your work and the savings and benefits will follow of their own accord!
by Diana Pereda

Every analyst has a few things they really don’t want to hear during the course of their work. These comments often indicate that proper maintenance activities have not been performed on the equipment, or convey unrealistic expectations of the analyst’s abilities. For instance:
- “It has always run like that!”
- “It really was making a noise before you arrived.”
- “We don’t have time to change the bearings. Just balance the machine so we can run it.”
- “How long will it last?”
- “Those bearings are brand new so I know they’re good.”
- “Yeah, we just use a torch to heat bearings to install them.” Use a SURETHERM induction heater with automatic demagnetizing to properly install your bearings.
- “We don’t have a bearing heater so we use a pipe and hammer to drive the bearing on.” Use a SURETHERM induction heater with automatic demagnetizing to properly install your bearings.
- “All we collect are overall vibration values, they tell us everything we need to know.”
- “It doesn’t take us long to change belts cause we just roll them on.” Very bad practice! Use a laser tool like the SHEAVEMASTER and loosen the feet of the motor before installing the new belts.
- “We don’t use no fancy alignment tool. All we need is a straight edge.” A recipe for disaster! Get a good laser shaft alignment system like the Easy-Laser XT770 —the money this will save in lost production and unnecessary repairs will more than pay for itself, not to mention the time saved for the analyst who can now dedicate himself to finding other more complex vibration problems.
- “My screwdriver does not confirm your analysis!”
- “You found the problem. Now go fix it.”
- “I didn’t realize you needed training.” Sign-up for a LUDECA vibration analysis training class.
- “I didn’t realize that this CM technology would create so much work.”
- “We need you to stop using that CM technology and turn wrenches this week.”
- “We didn’t realize you had identified and created a work order to fix that problem before it failed.”
No doubt you’ve heard a few more! Feel free to share them with us.
by Gary James CRL
A vibration analyst is constantly viewing data and seeking to identify indications of sub-optimal physical properties indicated by specific vibratory behavior. Most complex systems (if vibration analysis is allowed to be called a system) can be broken down into simpler sub-systems. Some of us, this blogger included, benefit greatly from such simplification in the vibration analysis process. This blog is about one such simplification which may be a helpful addition to the reader’s set of vibratory behavioral pattern recognitions.
As an analyst progresses in the field of vibration analysis, they will come to appreciate the phase property of vibratory behavior. Phase is used most often to look for defects by comparing it across couplings, from top to bottom, or end to end of structures, machines, or machine trains, etc. Here, the author would like to offer a more simplified way to use phase than is often taught or talked about, at least by those who work mostly with anti-friction bearing machines.
Phase in a single bearing:
Let’s approach phase in its simplest form: a single shaft in a single rolling element bearing. A perfect shaft in a perfect bearing, with everything done perfectly; no unbalance, no misalignment, no defects, will have zero relative phase difference between V(ertical) and H(orizontal). In fact, it will not vibrate at all. Because perfection does not exist, we don’t need to worry about running into it.
The machines you will run into will vibrate and the vibration will have phase. The phase of vibration measured at a single bearing will be caused by the imperfections acting on that bearing/shaft assembly. Consider the most common “near perfection” you will likely encounter in the day-to-day life of a condition monitoring technician. This near perfection machine has been aligned well enough for misalignment to contribute virtually nothing to the vibration signal, no bearing defect vibration, only the slightest rotational frequency vibration presumably contributed by a miniscule amount of residual unbalance.
The phase at rotational frequency on this machine will have an almost perfectly circular orbit and show an almost perfectly predictable 90° relationship between H and V. Now consider, if the unbalance increases, without any contribution from other defects, this 90° phase relationship will become even more stark, because the amplitude will increase making the phase reading more stable.
What about misalignment?
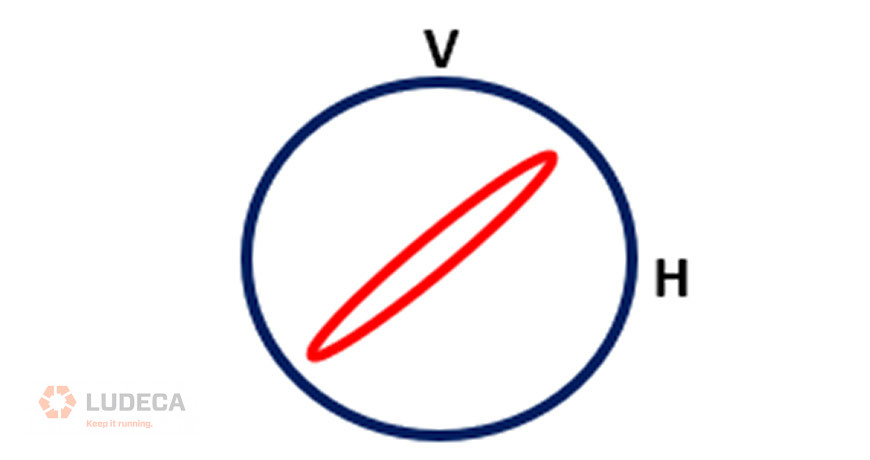
If misalignment were introduced into our “near perfect” machine, the orbit of the shaft in the bearing would almost certainly lose its circular motion and take on a herky-jerky motion characteristic, because now the shaft is prevented from the motion that unbalance induces on the shaft, by the restraint imposed by the misaligned bearings. The fact is that the perpendicular phase will now tend toward being either 0° or 180°. Just like the 90°-phase relationship which gets more pure as unbalance severity increases, the 0° or 180° phase relationship is likely to become more pure with an increase in misalignment severity.
How can the phase relationship at two perpendicular bearing points on rotating equipment be 0?
One might wonder how the phase difference could be zero at two perpendicular points. In this case, it helps to visualize the orbit of the misalignment-restricted shaft within the bearing. In the bearing orbit shown in figure 1, the amplitude at rotational frequency recorded on the V sensor and that of the H sensor are maximum at virtually the same instant.
Cautions:
There are other less common possible causes of the vibratory behavior of the very elongated orbit, such as resonance. A simple way to rule out resonance when possible, is to change the rotational frequency by 15% and then make a new observation. A cocked bearing would be an even more unlikely suspect if shaft misalignment is ruled out.
Download our 4 Stages Bearing Failures infographic for a basic reference guide to understanding the stages of bearing failures.
by Diana Pereda
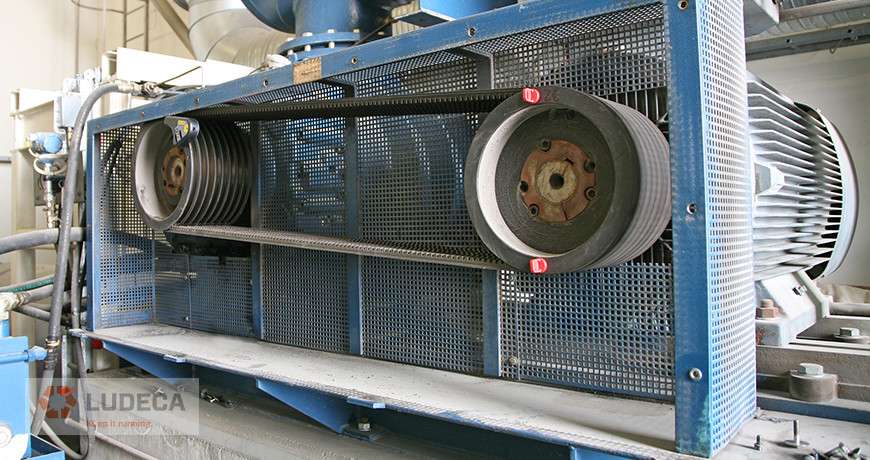
Proper location is very important when collecting vibration measurements on a belt system. If possible, one reading should be taken in line with the sheaves and one reading perpendicular to them on each bearing. Vibration data resolution should be taken into account so that proper separation between belt and driver frequencies can be obtained. Care should be taken to ensure proper belt alignment as well. A laser pulley alignment tool provides the most efficient means to properly align belts. Another issue is how the belts are installed. Was the equipment loosened and the belt put on properly? Were the belts instead rolled on by force, creating potential issues? Have you ever seen a Vee belt running upside down? This is usually caused by the cording in the back of the belt being broken often caused by rolling on the belts. Are sheave gauges being used to check the sheaves for wear? In some cases, the cost of a belt is more than the cost of a new sheave. These are just some of the things to consider for proper installation, maintenance, and identification of belt-related problems.
Don’t just assume that belts are simple and do not require best practice actions for proper operation.
Don’t Forget To Inspect Your Belts! 9 Preventive Maintenance Tips
by Gary James CRL
- Shaft speed of machine being analyzed
- Type of bearings involved (sleeve vs. rolling element)
- Rolling element bearing part number(s) and manufacturer(s)
- Internal configuration of equipment
- Machine History
- Proper data collection location
- Proper sensor to use for data collection
- Proper data collection setups to ensure correct data is collected
- Is the primary energy sub-synchronous, synchronous or non-synchronous?
- If the time waveform is collected in acceleration then what is the “g” level?

by Gary James CRL
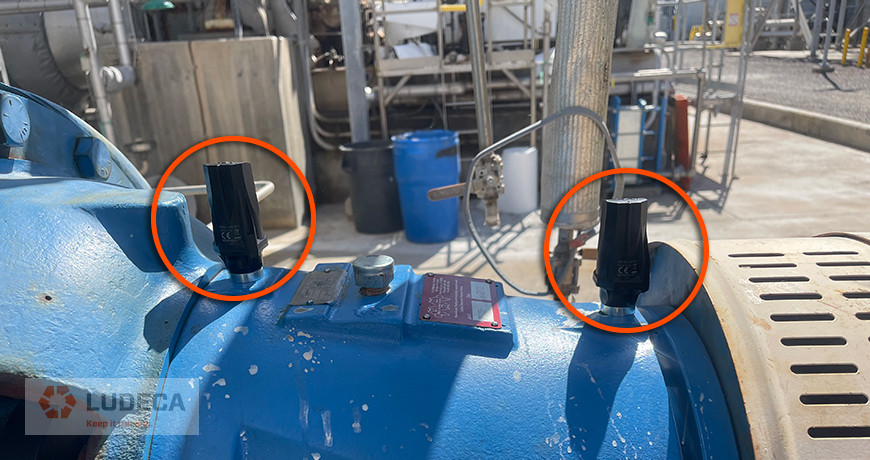
When it comes to analyzing vibration, sensor placement is key to quality of data capture. Motors can be large, surrounded by equipment and difficult to access, so locating an area to place your vibration sensor can be harder than it looks. A poorly placed sensor can, at best, reduce the vibration getting to the sensing element, and at worst, give completely invalid results, wasting time or even missing potential failure frequencies.
Placing a vibration sensor as close to the bearing as possible is the ideal scenario, but anywhere on the solid chassis that houses the bearing is normally sufficient. This is because the high frequencies that a bearing generates during a fault dissipate quickly in metals, reducing the amplitude of the vibration signal. These signals dissipate even more so when crossing an interface boundary, such as a bearing housing to another substructure. As a rule of thumb, try to mount a sensor within 1 foot (25cm) of the bearing to get the best results.
The absolute worst place for a sensor is on partially connected machine component, like the fan housing on a motor, or the connection box. Another location that is common for sensor placement, but is generally a bad idea, is on the motor cooling fins. As these protrude unsupported from the motor, they can resonate at other frequencies, giving further false results.
The interface between the sensor and the mounting surface plays another role in data quality. Magnetic mounts work well for fast mounting but start to attenuate signals above ~5kHz. When using a glue make sure to use a metal-based epoxy that is suitable for vibration signals, be aware of softer epoxy glues with flexible content, as they can drastically impact the signal. Mounting with a stud is always going to provide the best results and will work well, even above 10kHz Fmax.
Acquiring vibration signals should always be completed by an ISO Cat-I vibration analyst or above, as they are trained to do this. When mounting a sensor for continuous monitoring always seek the advice of an expert if unsure.
Thank you David Procter with Sensoteq for this informative article!
Download our Wireless Vibration Monitoring with Kappa X infographic to learn with an illustration how our Kappa X wireless triax sensors collect vibration and temperature data and move it to the Cloud via gateway for remote and continuous asset health monitoring with its Analytix software.
Choosing The Right Machines for Wireless Vibration Sensor Placement
by Diana Pereda
Every person that performs vibration analysis develops their own analysis process. Suggested steps at a minimum should include:
1. Open the spectrum (FFT) and locate the running speed peak and reset the reference speed to that speed. Since all induction motors vary in speed based on the load, this is necessary for accurate analysis, particularly at multiples of running speed.
2. Are there any peaks of interest?
3. Where is the primary energy located?
a. Is it sub-synchronous, synchronous, or non-synchronous?
4. Do the waveform patterns support the peaks in the spectrum (FFT)?
5. Remember that defects follow patterns. Some defects happen at frequencies less than running speed (sub-synchronous) or at running speed or at multiples of running speed (synchronous), or at frequencies greater than running speed but not at whole integers (non-synchronous).
6. Learn pattern recognition and don’t overlook the obvious.
Learn about our vibration analyzers
by Gary James CRL
In the bustling world of industrial operations, machines are the workhorses, tirelessly powering production lines and driving progress. But just like any workhorse, they need their health monitored to ensure they’re performing at their peak. Enter vibration data—the secret weapon of predictive maintenance. Below are the top benefits of harnessing this data:
-
Early Problem Detection
Imagine your industrial machines as if they were cars. Just like a car makes certain sounds when something is wrong, industrial machines create vibrations that can tell us if something isn’t right. By collecting and analyzing these vibrations regularly, we can spot small problems before they turn into expensive repairs. This means we can fix things before they break down, saving time and money.
-
Keeping Operations Smooth and Efficient
Industrial machines are the backbone of operations, and any disruption can send ripples through the entire process. Vibration data helps us ensure that these machines are running smoothly, minimizing downtime, and maximizing efficiency. Monitoring the condition of an asset regularly, whether with a handheld vibration analyzer or a permanently mounted solution, can send warning signals when there are elevated vibration levels so that the plant can make necessary adjustments to make sure everything runs like clockwork.
-
Enhancing Safety and Preventing Accidents
Safety is paramount in any industrial setting. By monitoring vibration data, we can identify potential hazards before they escalate, preventing accidents and ensuring a secure working environment for plant employees and stopping potential environmental disasters that can affect the surrounding neighborhoods. It’s like installing Automated Emergency Braking (AEB) in a car—a proactive measure to protect the car, the driver, and its surroundings.
-
Extending Equipment Lifespan
Just as regular exercise can prolong human life, proper maintenance can extend the lifespan of industrial equipment, with emphasis on proper. Vibration data enables us to detect and address issues early, keeping machines in optimal condition. This can also reduce the need for premature replacements, which often lead to infant mortality of rotating equipment. It’s an investment in longevity.
-
Optimizing Resource Allocation and Decision-Making
Data-driven insights from vibration analysis empower informed decision-making. By pinpointing areas that require attention, organizations can allocate resources effectively, optimizing maintenance schedules and expenditures. It’s like having a GPS for maintenance—guiding us along the most efficient route.
In essence, vibration data is not merely a collection of numbers—it’s a roadmap to operational excellence, guiding organizations toward smoother operations, enhanced safety, and prolonged equipment lifespan. By harnessing its power, industries can navigate the complex terrain of maintenance with confidence and foresight.
Do you archive your historical vibration data or keep it around forever?
by Adam Stredel CRL
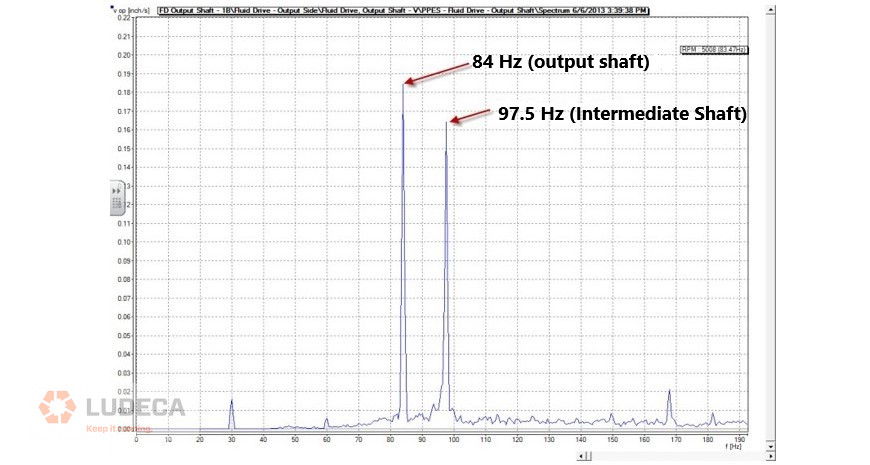
Setting the correct lines of resolution (LOR) can sometimes be challenging. In the example below we have a single-stage increasing gearbox. The gearbox is designed with three individual shafts (input shaft, intermediate shaft, and output shaft), all enclosed within a single gearbox housing.
The speed of the input shaft is constant at 29.93 Hz (1796 rpm) and attached to this input shaft is a pinion gear with 88 teeth. The pinion gear runs in mesh with a gear with 27 teeth which is mounted onto the intermediate shaft. This results in a gear mesh frequency of 2633.84 Hz (158,030.4 cpm). Now we need to determine the required Fmax. Therefore, we simply multiply our calculated gear mesh frequency times 3.25, which gives us an Fmax of 8559.98 Hz (513,598.8 cpm). In the software, we can’t select the value 8559 Hz, so we’ll need to select the next higher value which results in a Fmax of 10kHz. The next step in the process is to determine what the speed of the intermediate shaft is, and we can do this by using the following formula:
Intermediate shaft speed = 29.93 Hz × 88 teeth = 2633.84 Hz / 27 teeth = 97.54 Hz, or 5852.4 cpm.

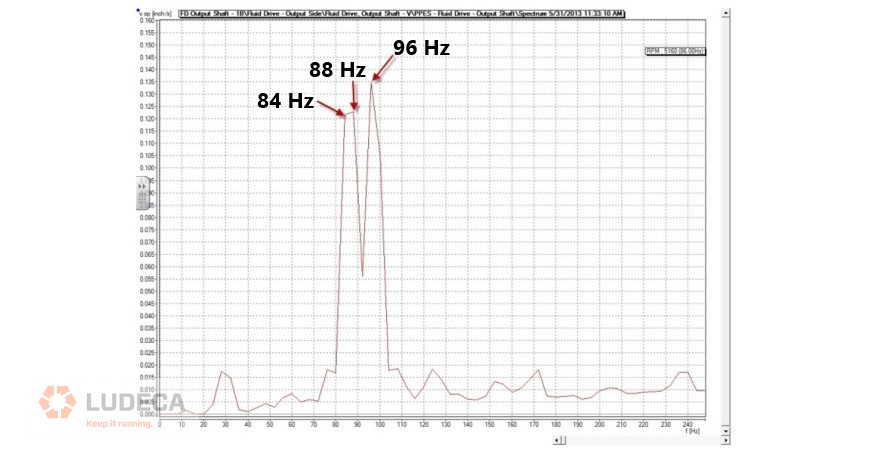
We now need to decide how many lines of resolution we are going to need since in this gearbox we have two closely spaced running speeds. We have the intermediate shaft speed which is running at a constant speed of 97.54 Hz, and we have the output shaft speed which is variable. When the boiler feed water pump is operated at 100%, we have an output shaft running speed on the gearbox of 94.33 Hz or 5660 rpm. There is only 3.21 Hz or 192.6 cpm between the two shaft speeds within the gearbox so our lines of resolution setting will need to be set high enough so that we separate them while performing analysis. With a Fmax setting of 10kHz, we will need to have a minimum of 3200 lines of resolution so we would have two discrete peaks for the two shaft running speeds.
Fmax 10kHz / 3200 = 3.125 Hz, but to be on the safe side I would recommend selecting the next higher resolution setting [6400 line] which will allow a 1.56 Hz [96.3 cpm] resolution which is sufficient to easily see the two different shaft running speeds for accurate analysis.
Below are examples of the resolution, the first not being set high enough (top) and the second with the resolution set correctly (bottom).
Improper resolution settings resulting in a flat top peak for the output shaft speed:
Correct resolution setting (allowing for the separation of the two shafts turning speeds):
by Diana Pereda
Everyone needs phase analysis. A phase study should be performed on problem machines when the source of the vibration is not clear, or when it is necessary to confirm suspected sources of vibration. A phase study might include points measured only on the machine bearings or it may include points over the entire machine from the foundation up to the bearings. The following are examples of how phase can help analyze vibration.
SOFT FOOT
The term soft foot is used to describe machine frame distortion. It can be caused by a condition where the foot of a motor, pump, or other component is not flat, square, and tight to its mounting, or many other things, such as pipe stress, machining errors, bent or twisted feet, and non-flat mounting surfaces. Soft foot increases vibration and puts undue stress on bearings, seals, and couplings. Soft foot on a motor distorts the stator housing creating a non-uniform rotor to stator air gap resulting in vibration at two times line frequency. A good laser shaft alignment system should be used to verify soft foot by loosening the machine feet one at a time. Phase analysis can be used to identify soft foot while the machine is in operation. Measure the vertical phase between the foot and its mounting surface. If the joint is tight, the phase angle is the same between surfaces. If the phase angle is different by more than 20 degrees, the foot is loose or the machine frame is cracked or flimsy. Download our Soft Foot Find-and-Fix infographic which outlines types of Soft Foot including causes and corrections.

COCKED BEARINGS AND BENT SHAFTS
Phase is used to detect cocked bearings and bent shafts. Measure phase at four axial locations around the bearing housing. If the bearing is cocked or the shaft is bent through the bearing, the phase will be different at each location. If the shaft is straight and the bearing is not twisting, the phase will be the same at each location.
CONFIRM IMBALANCE
A once-per-revolution radial vibration usually means rotor unbalance. Use phase to prove imbalance is the problem. To confirm imbalance, measure the horizontal and vertical phase on a shaft or bearing housing. If the difference between the phase values is approximately 90 degrees, the problem is rotor unbalance. If the phase difference is closer to zero or 180 degrees, the vibration is caused by a reaction force. An eccentric pulley and shaft misalignment are examples of reaction forces.

LOOSENESS, BENDING, OR TWISTING
Phase is used to detect loose joints on structures and bending or twisting due to weakness or resonance. To check for looseness, measure the vertical phase at each mechanical joint. When joints are loose, there will be a phase shift of approximately 180 degrees. The phase angle will not change across a tight joint.
SHAFT MISALIGNMENT
Shaft misalignment is easily verified with phase. Measure each bearing in the horizontal, vertical, and axial directions. Record the values in a table or bubble diagram. Compare the horizontal phase from bearing to bearing on each component and across the coupling. Repeat the comparison using vertical then axial data. A good alignment will show no substantial phase shift between bearings or across the coupling.
OPERATIONAL DEFLECTION SHAPES
Instead of comparing the phase and magnitude numbers from a table or bubble diagram, operational deflection shape software (ODS) can be used to animate a machine drawing. An ODS is a measurement technique used to analyze the motion of rotating equipment and structures during normal operation. An ODS is an extension of phase analysis where a computer-generated model of the machine is animated with phase and magnitude data or simultaneously measured time waveforms. The animation is visually analyzed to diagnose problems. ODS testing is able to identify a wide variety of mechanical faults and resonance issues such as looseness, soft foot, broken welds, misalignment, unbalance, bending or twisting from resonance, structural weakness, and foundation problems.
Phase and magnitude were measured from permanently mounted X and Y displacement probes on a turbine generator. The values listed in the table were used in ODS software to animate a stick figure drawing of the high- and low-pressure turbine shafts and the generator shaft. The picture to the right of the table is a capture from the ODS animation showing the vibration pattern of each shaft and the relative motion between shafts at 3,600 cycles per minute (turning speed). Many machines vibrate due to deteriorated foundations, looseness, the resonance of the support structure, and other problems that occur below the machine bearings. A phase study might include hundreds of test points measured all over the machine and foundation. Good ODS software can make it easier to analyze phase and magnitude data from a large number of test points. Analysis of an ODS involves observation and interpretation of the machine in motion.
by Diana Pereda
Consider how your vibration data collection instrument gathers information. This is a critical factor that can either streamline or prolong the data collection process within your facility. Typically, vibration analysts record and store an overall value (OA), spectrum (FFT), and time waveform (TWF) during each measurement. Some vibration hardware devices require separate measurements for each of these parameters. In contrast, modern day vibration data collectors offer the capability to capture all of these parameters and even more in a single measurement. This technological advancement has the potential to reduce your field data collection time by up to two-thirds. As a result, it not only boosts the performance of your Condition Monitoring team but also provides additional time for advanced troubleshooting methods, ultimately translating into cost savings for your organization.
Watch our Vibration Analysis Know-How: Quick Intro to Vibration Analysis video for a quick introduction to spectra, time waveform, and phase measurement.
by Diana Pereda
When acquiring new vibration equipment, it is important to delve into the genuine long-term cost of ownership, rather than fixating solely on the initial purchase price. The notion that the cheapest or most expensive option is always the wisest doesn’t hold true in this context.
To make an informed decision, it is imperative to account for expenses related to upgrades, support, calibration and servicing of the vibration analysis equipment. Equally critical is to factor in the cost of adapting or upgrading the equipment to evolving needs over time. Here are key questions to ponder, both for yourself and when engaging with potential equipment vendors:
- Upgradability: Can the equipment be upgraded, or does it necessitate complete replacement? Is on-site upgrading feasible, or does it require vendor intervention? What are the associated costs?
- Scalability: Is it possible to procure the equipment in a scalable manner? Opting for scalable equipment enables cost savings by allowing you to acquire the same device for all employees while customizing the features based on individual user requirements. This adaptability proves financially advantageous in the present and future.
- Alignment with Goals: Does the hardware and software align with your facility and corporate objectives? For instance, can the software generate essential matrix reports for tracking improvements over time? Does it adhere to corporate standards for alarms, measurement criteria, and the like? Can it seamlessly integrate with your CMMS software? Is data import from other technologies supported?
These questions are paramount for the sustained success of your reliability program and will ultimately define the genuine long-term cost of owning the vibration equipment under consideration.
by Diana Pereda

Selecting the appropriate machines for mounting wireless vibration sensors involves a thoughtful process that integrates criticality analysis and considerations of accessibility. Here’s a more detailed breakdown:
Criticality Analysis
Prioritize critical machines by identifying and prioritizing machines critical to your operational processes. These could be equipment with a significant impact on production, safety, or overall system functionality.
Evaluate the potential consequences of failure for each machine. Machines with higher risks and more severe consequences should be given priority for sensor deployment.
Accessibility
For hard-to-reach areas, where traditional wired setups may be impractical, wireless sensors such as the Kappa X offer a clear advantage. Consider places with limited physical access or spaces that pose safety challenges for personnel. Wireless sensors are also ideal for remote locations reducing the need for frequent on-site visits for vibration data collection.
Additionally, in potentially hazardous environments requiring explosion-proof measures, intrinsically safe wireless sensors provide a secure means for gathering both vibration and temperature data.
Historical Data and Maintenance Records
Examine historical data and maintenance records for each machine. If a machine has a history of recurring issues or maintenance needs, it may be a prime candidate for continuous monitoring using wireless vibration sensors.
By combining criticality analysis with considerations of accessibility, you can strategically select machines for wireless vibration sensor deployment. This approach ensures that the chosen machines align with the overall goals of predictive maintenance, providing valuable insights while maintaining operational efficiency.
by Diana Pereda
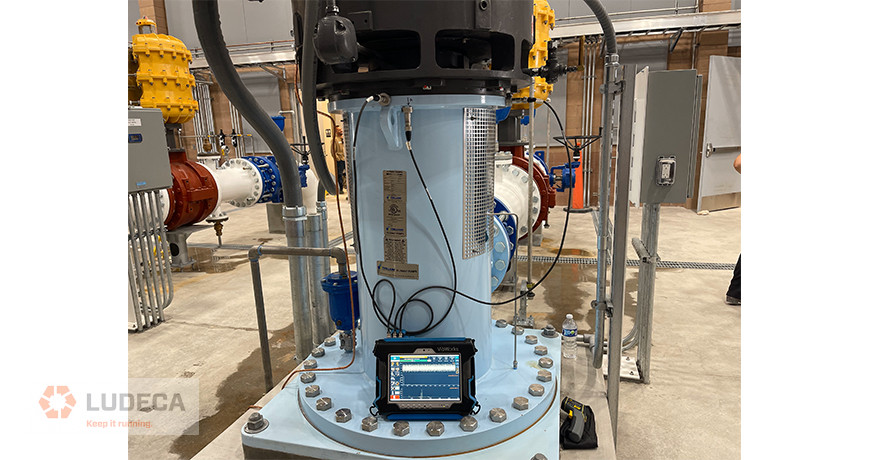
One of the largest power plants in the United States experienced issues with two out of three recirculating pumps, which are critical for generating power. Despite regular monthly vibration route data collection, the pumps were running louder than normal, indicating a potential problem. To avoid a complete failure that would halt power generation, the plant implemented continuous monitoring using Sensoteq’s KAPPA X wireless vibration sensor from LUDECA on one of the recirculation pumps.
CHALLENGES
- Criticality: The recirculating pumps are essential for generating power by providing DeIonized Water (DI Water) to produce steam for the steam turbines. A pump failure would result in a complete power outage.
- Cost and Lead Time: Replacing a pump was estimated to cost $120,000 and would take approximately 16 weeks, causing significant financial and operational setbacks for the power plant. The ZLD area at which the pump operates is also critical to clean up the pond water to ensure the site also maintains zero liquid discharge from the facility, thus recycling all water and ensuring maximum sustainability of the most precious resource at any power plant, especially in the desert, that being water.
Click here to continue reading this case study and find out what steps were taken to get the project started and the results achieved after implementing continuous monitoring using the KAPPA X wireless vibration sensor!
by Diana Pereda
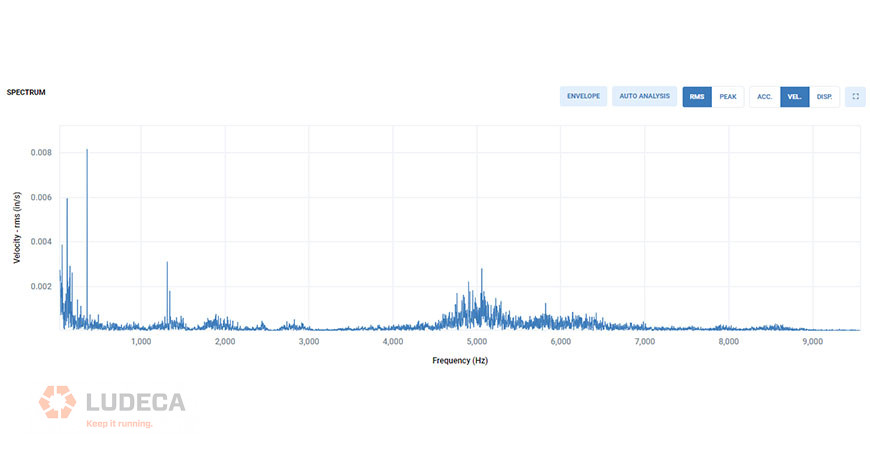
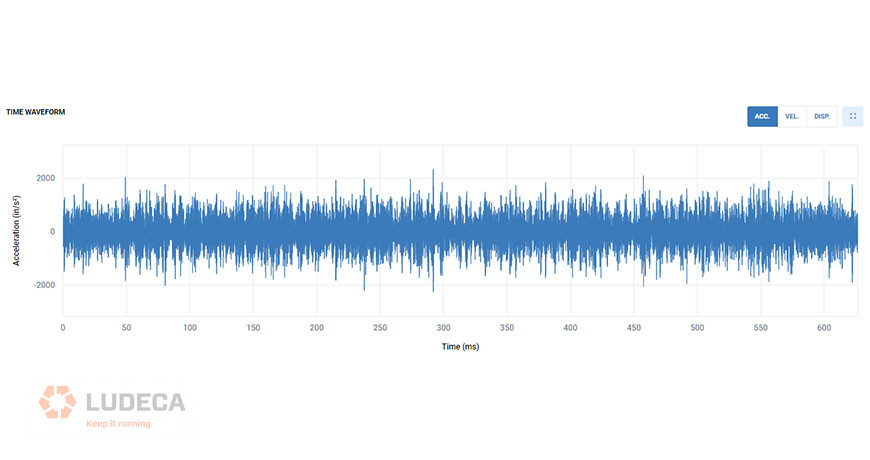
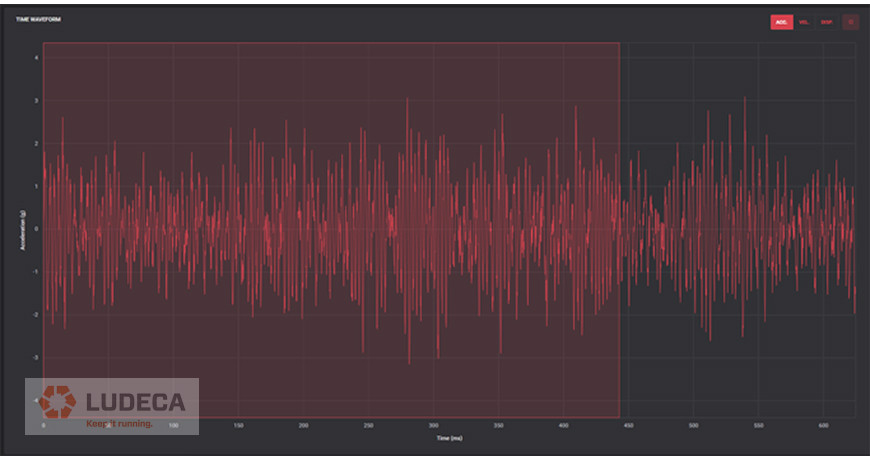
When monitoring the vibration data of a machine, an analyst will want to look at the Time Waveform (TWF) and the Frequency Spectrum or FFT (Fast Fourier Transform) output, as shown below.
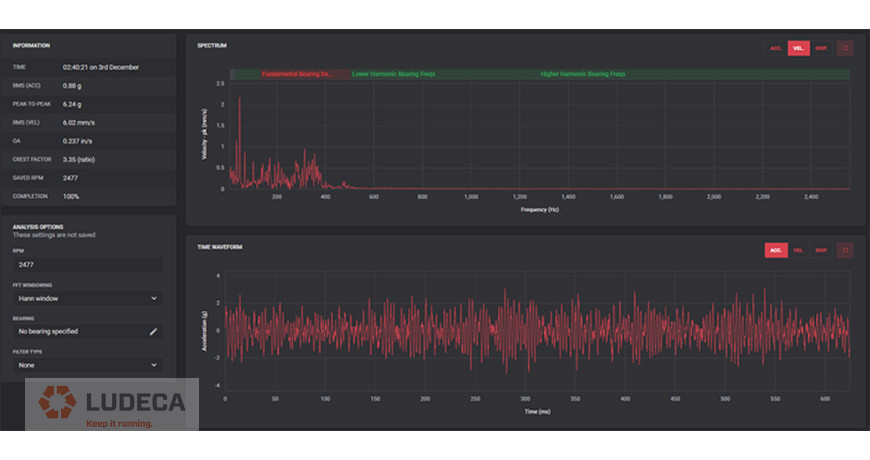
These two example plots are very useful for determining obvious failure modes, such as, an imbalance with a high amplitude value of Overall (OA) Velocity in the 1 X RPM band or a slippage between two components causing amplitude modulations or beat frequencies visible in the TWF.
For more complex analysis, analysts require further tools to diagnose better the issues. Playing the TWF as an audio file is a good way of listening to the vibration to potentially hear knocking, pinging or high frequency whistling, denoting a problem to further diagnose, as if you were actually beside the machine.
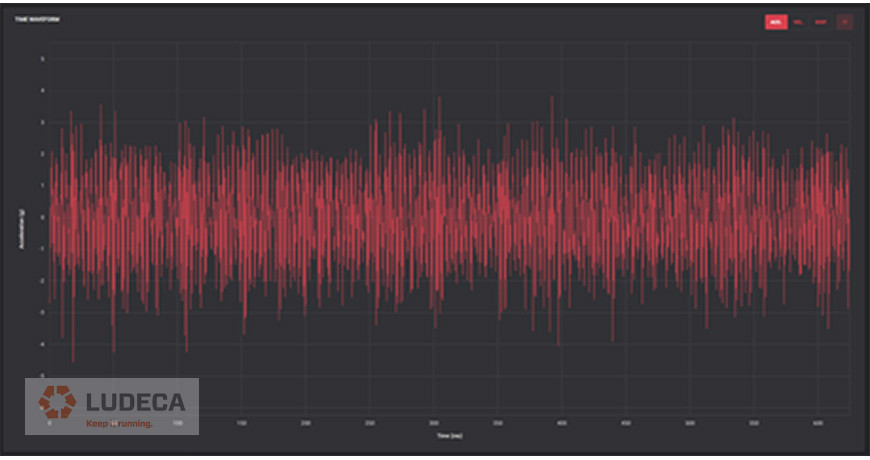
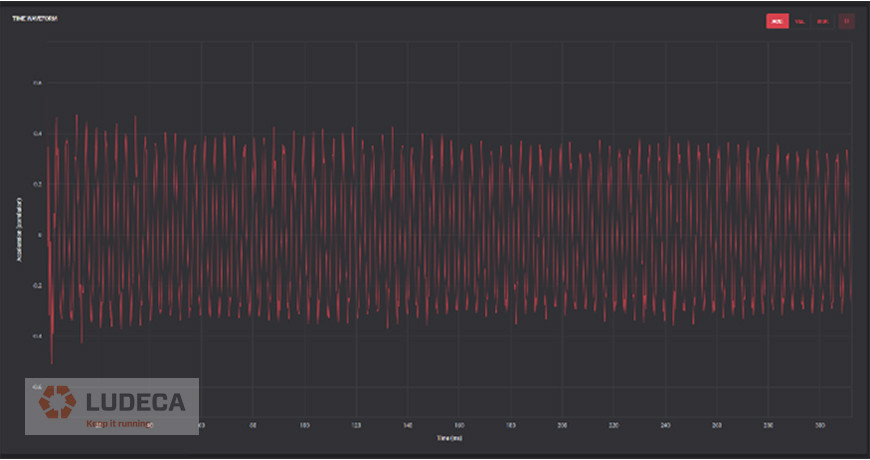
Auto-correlation and circular plots are two other useful techniques applicable to the TWF. Auto-correlation can be useful to remove noisy signals and determining the periodicity or repeating patterns in the vibration signal. The TWF below shows this before and after auto-correlation is applied.
Finally, an additional step to visualize this better is to perform a circular plot. In the example below the three peaks indicate this application is a pump with three vanes. In this plot view using it can easily determine such failures as a broken fan blade, an imbalance on a vane, or rotor bar issues (if on a motor).
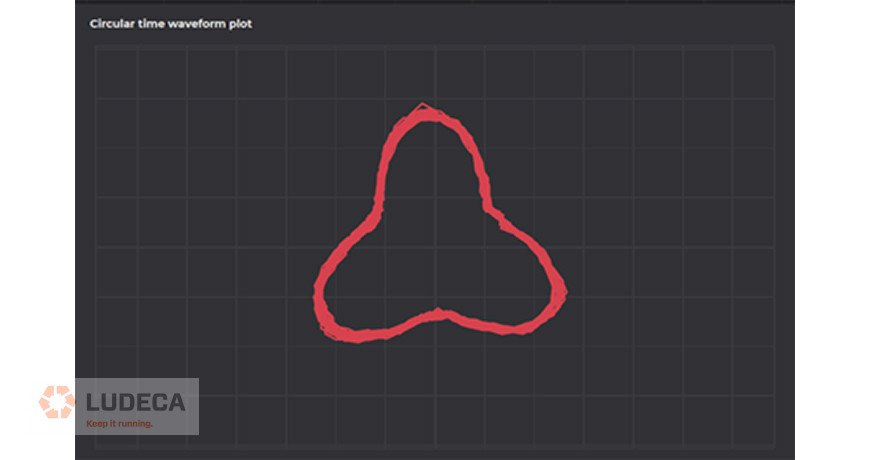
So as a vibration analyst make sure you use all the tools available to you in your software platform for ease of your analysis.
Thank you Alan McCall with Sensoteq for sharing this informative article with us!
by Diana Pereda
Machines are like people. They all have certain similarities but are different in many ways. Two exact machines in the same operation may perform and respond quite differently.
Setting alarm values for your vibration measurements is critical for the success of your vibration monitoring program. Alarms will help the analyst identify when conditions on the machine have changed and assist in identifying specific fault conditions. All of this makes the analysis much more accurate and easier. Additionally, this can reduce the amount of time required to analyze the vibration data collected. However, for all this to work the alarms must be set up correctly.
Does the question become what alarm values do you use? Determination of alarm values is especially difficult for the inexperienced analyst, or when no historical data is available for the equipment. Many sources have published generic alarms based upon specific equipment types and operational speeds. These published alarms can be very valuable in certain circumstances. However, as stated previously, machines are like people and are different in their performance and responses. The best method is to collect data on the equipment for a period of time and set statistical alarms for each machine based on its unique operating characteristics, performance, and type.
This method will always provide the best results for your vibration program and increase the accuracy of your analysis.
Check out our VIBWORKS vibration analyzer.
by Trent Phillips